Friday, November 6, 2015

KKK Locations and Concentration in the United States

Mr. Terrific vs the KKK

I wanted to originally title this post as "Racism in the USA" but I realized this really only scratches the surface of the different hate-groups that exist in America (sadly). =/ This is definitely one of the worst datasets I've ever looked through. *pukes*

This information came from a cursory scrape of the data dump from Anonymous last night 11-5-2015. I decided not to map the individual people's data as those wouldn't give us the succinct kind of picture we get when we look at the data as far as groups in several different ways.

I used Tableau Stories as I felt you can step through the data in a more meaningful way. I'll outline in below then you can dive into the data:

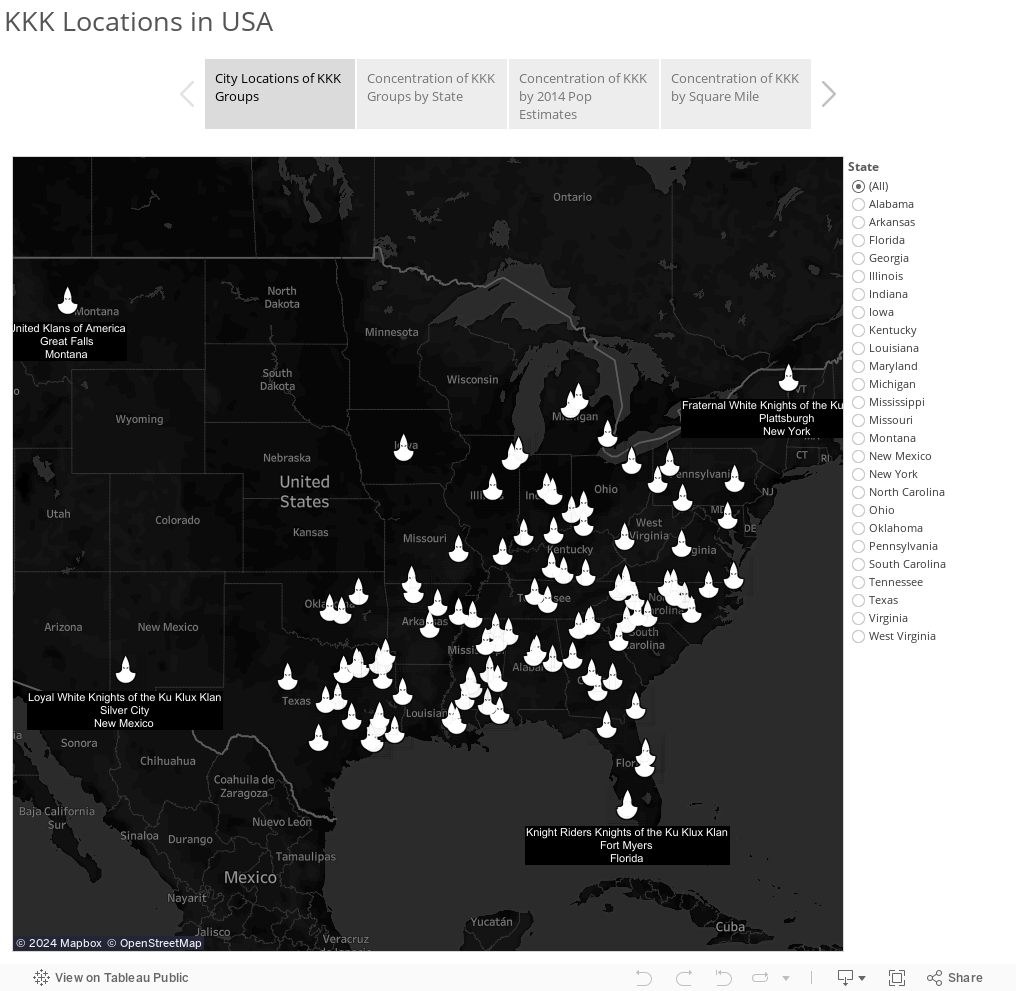
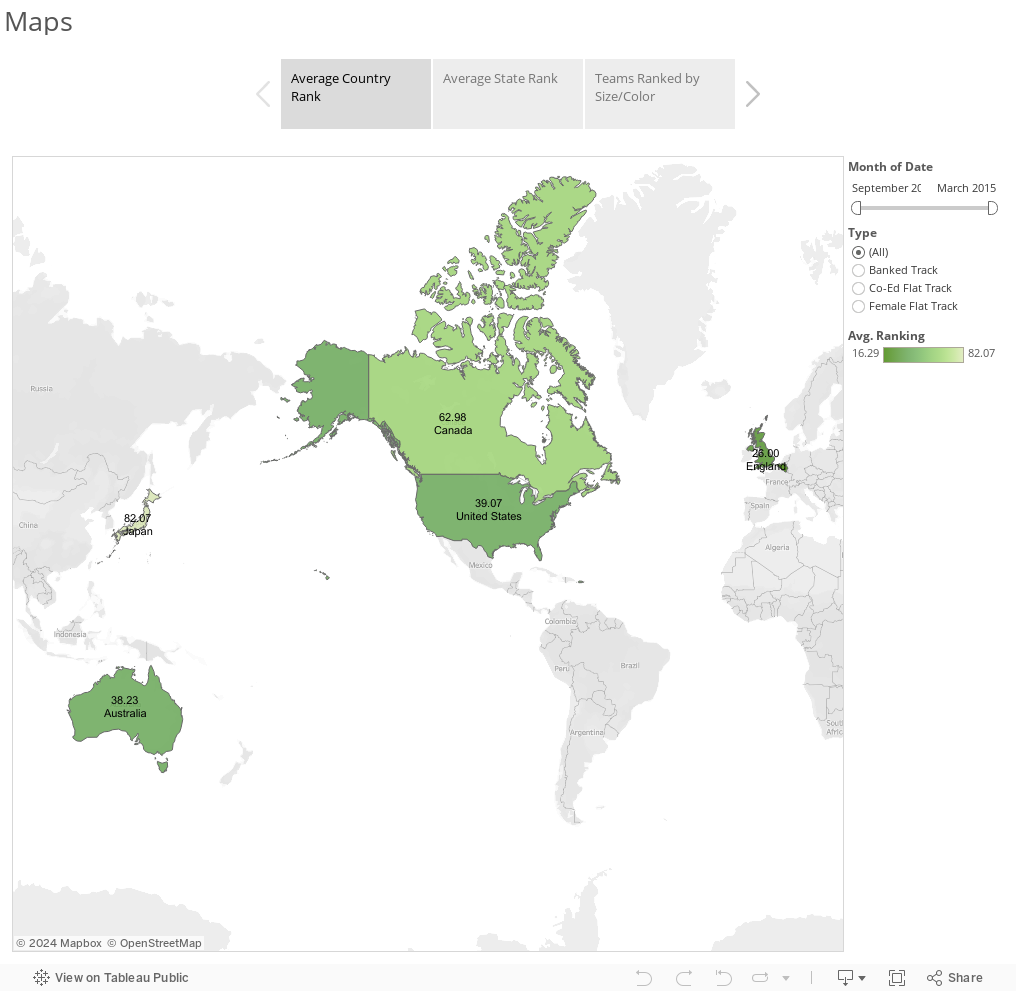
  • First off you can see the actual city locations of KKK groups.
    • You'll notice a STARK lack of anything in the western United States.
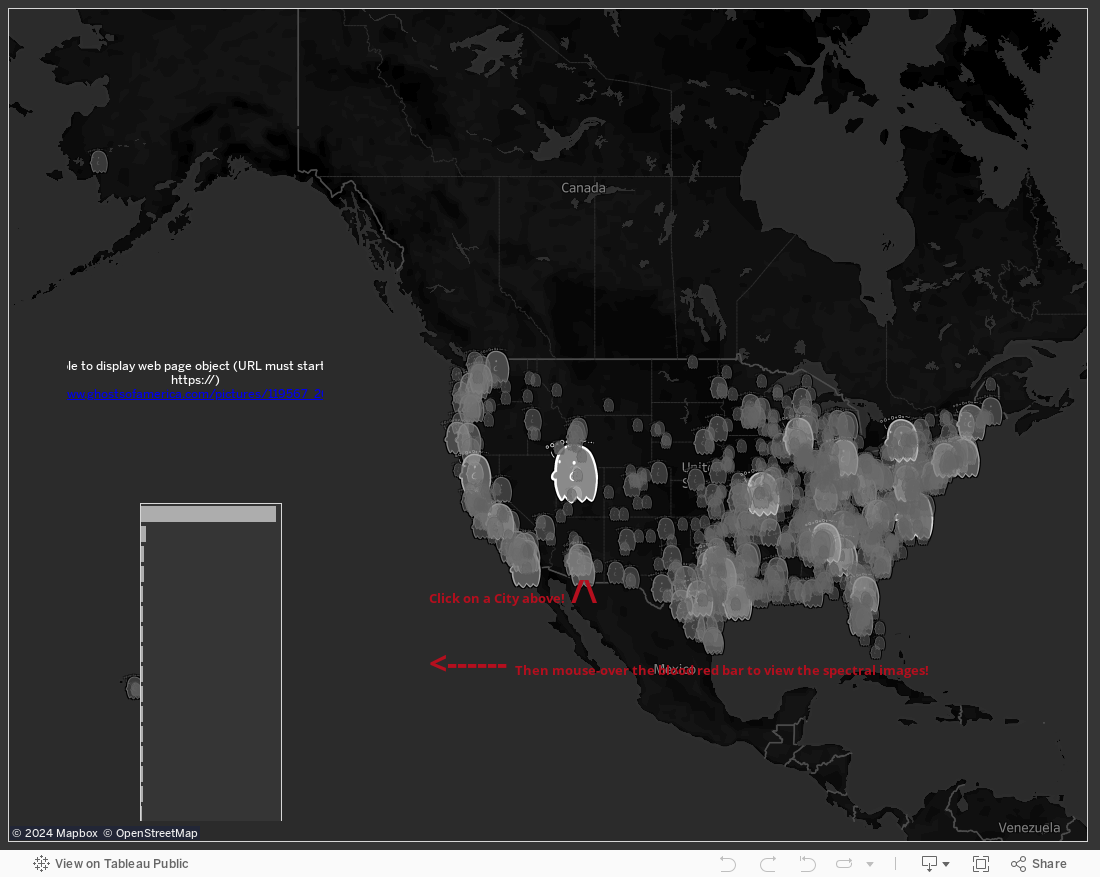
  • Secondly there is the concentration for NUMBER of KKK groups per state.
    • Wow... umm... yikes Texas. =(
  • Thirdly is the number of PEOPLE PER KKK group (not people IN each group).
    • I used 2014 Population Estimates based on the actual 2010 Census numbers.
    • OK... now yikes Mississippi!
  • Lastly is the square miles per state divided by number of KKK groups.
    • Here you'll notice several states previously not very dark become much more prevalent (again casting larger states like Texas in a better light).


As always if you have questions/comments/concerns please contact me at @wjking0

Friday, October 30, 2015

Spoooooooooky "Ghost" Photos by City/State


The thing about superstitious beliefs is that it's hard, REALLY HARD, to get a set database to work from to try to sketch it out visually. That being said the closest thing I was able to find as far as any sort of database of spooky events with significant numbers I could use to visualize creepy activity is the Ghosts of America site.

I wanted to scrape their entire archive for every single city but I realized that I'm almost SURE their site is hand-written so I wasn't able to get data extractors to crawl it successfully. Instead I figured out the best laid our part of their site for scraping purposes would also be the part I would want to use. So I went ahead and scraped the "photos" section of the Ghosts of America.

The state results are as follows:


For a city-level look here:


As you may have been able to tell at this point there are lot of "questionable" ghosts photos out there... ;-) As usual if you have any questions or concerns hit me up on twitter @wjking0 and I'd be happy to talk them out! In the meantime just remember most ghosts are quite what they seem....


Friday, October 16, 2015

Kentucky WIC Usage 2000-2013


As a non-native Kentuckian I wasn't sure what WIC usage looked like in this state. My assumption was generally that WIC was something you'd see more of in large developed cities. It turns out I was wrong.

The data used came from the following:


For the calculations I applied the numbers to total calculation and not to subgroups for women or children under 18 so usage percentages for those may be higher but I don't have the WIC info regarding numbers of mothers vs children utilizing services so I didn't want to further muddy the numbers.

Also for these calculations I applied the 2000 census amounts to the 2000 WIC numbers and then for the 2006-2013 WIC numbers I used the closer 2010 census numbers as populations estimates for most regions were fairly stable over that time period.


As you can see, the large urban areas of Lexington and Louisville (Fayette and Jefferson Counties respectively) have fairly low usages of WIC (<2%) while areas particularly in eastern KY you can see have fairly high/consistent usage. I haven't done cost analysis yet but once the USDA fixes their website and I can get some more in-depth numbers I should have some more data to play with.

As usual hit me up at @wjking0 if you have any questions or concerns or just want to talk about public data!

EDIT: I've added the second dashboard/story as there was a request to look at the comparison of WIC % to Median Household Income so I crunched that out real quick:


Thursday, October 15, 2015

Can We Build An Ethical Car?


This post is a little bit removed from my normal dataviz stuff but given Tesla's announcement yesterday now is the time for this post to come out! Besides, it's finally a chance for me to get to use my Philosophy degree!

I've been thinking for the last several years what the driverless-car revolution would really be like. When the first couple of driverless cars completed DARPA's car course in 2005 and the future became much more real an article came out (which I've sadly lost the link to) that made some very salient points which I'll try to summarize now: 
  • The majority of cars spend their time idle/parked.
  • If the price of driverless cars is prohibitive, wouldn't it be easier to spread that cost out with some neighbors since the car is only occupied for a brief time by each person per week?
    • The downside of that is most people need cars are certain times to get to work on time, home, to pick up the kids from school, etc.
  • Instead of splitting the cost of 'your' car with the neighborhood, what if instead you subscribed to a car 'service' (much like you currently subscribe to Netflix vs owning all your movies now)?

The ultimate point is that, in the somewhat near future, I think we can all agree that a large portion (if not all) cars will become driverless. They will be controlled by certain AI and algorithms that will enhance their safety features and reduce car-caused fatalities by a VAST number. We can already see that the initial rollout of driverless cars from Google have been in accidents where other drivers are at fault.

Here's the thought experiment I want you to conduct:

There are  two autonomous cars are next to one another on a bridge. The unthinkable happens and a large item falls off the back of a semi truck landing directly in the path of one of the cars. Let's say both have at least 1 person in them and there is a 100% of ONE of the vehicles inhabitants not surviving the crash (I think we've all seen Final Destination...).

OK, so who gets to live? Software has to make that decision. Let's assume that both cars have the same AI/decision-making software in them (we'll get to a different idea in a sec). We can assume that in this point in automated driving cars would communicate with one another for enhanced safety such as warning about large obstructions, potholes, etc. What if one of the vehicles that was going to crash had a single person in it and the other vehicle had a family of four?

We would think at that point the cars would do a math to calculate that > lives = better! What if the single individual was someone working on ground breaking research into cancer treatments? Do we want cars to rank our lives? If you recall this type of software biasing for life/death was one of the crucial turning point (spoilers) for Will Smith's character in the movie iRobot.


In the beginning of the film Will Smith's character has a car accident and a robot AI jumps into a freezing lake as his car is sinking pulling him (and NOT his young son) to safety despite his protests that the robot should save the son instead. Will we get to choose? Will future cars ask for our preference for these types of ethical situations? Could I say, 'In the event that my car is spinning and going to collide with an object please make it on my side vs that of my daughter' ? Could we value high numbers of lives over our own or will the software choose for us?

Additionally... let's return to the idea of differing software. Would different manufacturers have different ethical applications running in their cars? If two cars were on a bridge from different auto-makers would they fight over whom gets to live?

Anyway... I know it's not my normal dataviz thing but I wanted to post this out here to get at least a small number of you all thinking about what driverless cars mean for robotic ethics. It's a HUUUUGE deal (in my opinion) and I figured I should open up a dialogue about it! Comments are always welcome on my twitter @wjking0 so shoot me your thoughts and let's have a discussion about car AI ethics!


Wednesday, July 8, 2015

Quick Viz for Bluegrass 10K 2015


I don't have a lot of commentary on this but I just threw it together real quick to see if there were any inconsistencies or specific gender differences in runners.

Here are the relevant links:


Here's the viz you can click around in and check out, filter by Division, Gender, etc.


Tuesday, June 30, 2015

Kentucky's Gay Marriage Denial by Zip Code (Updated 6-30-2015)

Gay Marriage Denials in KY (by Zip) and "Small-town-ness"


I was working on a little something else for another blog post but given the prevalence of the state of Kentucky in the News I figured I should crunch these numbers real quick to see if what I'd been suspecting has been true.

While I'm still going to publish my ultimate "Churches vs Stoplights" viz blog post at some point I won't show all my cards for that one. Where I grew up in WV we used to joke that the measure of a "Small-town" was if it had twice as many churches as stoplights (as mine did). So I'm using that as my "small-town" base. Then I used the current list of counties denying marriage licenses to couples since the ruling from the SCOTUS and broke those down into their applied zip codes. The results are as follows!


If you'd like to see how your zip code fares do a search for it here:


So it turns out that most "Small Towns" (at least by my own made-up definition) are actually OK with the SCOTUS ruling! This wasn't the result I was expecting at ALL! I'm not saying that these places are accepting or even friendly to my LGBT brothers and sisters but I'm saying that the places listed are at least adhering to national law so please take all this with a grain of salt!

If you have any questions/comments/concerns shoot me a message @wjking0 on Twitter or comment here on the blog!


Thursday, June 18, 2015

University of Kentucky Salary Data (2014)


So I like malleable things... like playdoh. As most of you know I was out with a broken leg based on one of my prior blogs. While I was out I worked with a LOT of public data sets. Finally I sat down and scraped UK's Salary data from several different public resources.** It was the 2014 data but I figured it would still let me do some fun things with the data.

So let's get right to it! The fields that were available were as follows:
  • Department
  • Description ("Job Code", Professional, Exec, Faculty, etc)
  • Title (Job Title)
  • Status (Full Time / Part Time)
  • Salary
  • Start Date (BIG NOTE, this is their start date at the University NOT their start date for that particular position!)
  • Years Worked (which I derived from Start Date)
Without any further chatter let's look at what you came here for! This first dashboard is just something pretty I whipped up to be able to visualize EVERY employee at the University of Kentucky. Continue scrolling down for further explanation of each dashboard and how it works!


This second Dashboard is just to look at the salary vs years worked for employees.


Finally this is the big one! This third dashboard is a list of every Title by Department regarding Status and Description by Salary and Years Worked. You'll notice that off to the right-hand side of the viz you'll see Average and Median's for both Salary and Years Worked. These are dynamic and what you see currently is the Averages and Median's for EVERY employee at the University of Kentucky. What makes this Viz very powerful is the ability to click on Title (Job Title) to see the median/averages for that particular job. Interested to see where you fall in the scale of your particular position? You can know that now! See how your length of service at the University compares to your peers but please keep in mind that the years worked DOES NOT mean years worked in that particular job, just total at UK!


What do you all think!? Please hit me up on twitter @wjking0 or comment on the blog and if you like what you saw here I have TONS more public data coming from my two months of FMLA leave sitting around with a broken leg! Subscribe via your RSS readers!

**Also I'd just like to note that all this data was scraped publicly using freely available tools such as the AMAZING Import.io and some URL builders while I was at home on FMLA so none of UK's time/resources went into these viz's.


Tuesday, May 19, 2015

So. Much. Data. *heavy breathing*


So it's been a while since I posted. Sorry about the delay I've just been overwhelmed with WHAT to post. Right now I've got a lot of irons in the fire but the big thing is I'm doing a Tableau presentation on Friday which I've essentially had more than 2 months to work on and I'm only presenting for an hour! I've got WAAAAAY too much stuff to fit into an hour presentation!

I'm going to show off:

  • My work in Import.io using Bulk Data Extraction from set URLs
  • Data Sets of Interest
    • UK Salary Data
    • Lexington City Salary Data
    • Twitter Data
    • Instagram Data

So it'll be a busy day just showing where to get all this stuff and what you can create with it! Hit me up on twitter @wjking0 if you have any comments/suggestions/etc.

Friday, April 17, 2015

Stupid Broken Leg (aka GIVE ME THINGS TO VIZ!!!)

A little back-story...

Sunday April 5th I was involved in an accident that left me with multiple ankle breaks and a fibula break in the upper section of my lower leg (close to my knee).
Thursday April 9th I went in for surgery on my leg/ankle (yea, it was pretty bad) and they put a plate and some screws in to keep my leg together.
I'm currently on FMLA (Family Medical Leave Act) and I'm unable to be at work until I go back to the doctor (which is currently not until the 28th for those keeping count).


The upshot is I have a LOT of spare time on my hands right now and not much of anything to do with it!

So since I'm laid up and to keep my mind occupied I've been working on all these data visualization projects. Sadly due to pain medication focus has been a real issue... fortunately it has allowed me to really flow from project to project without getting worried about it. The other day I thought "man, it's nice (looking) out today"... so I started collecting weather data. Now I have the ENTIRE history of Lexington's weather hour-by-hour for the last SIXTY-FIVE YEARS (that's 569,790 measurements for all you math nerds out there). So far one of the neatest things I've made is this:


This is a view of the temps in Lexington, KY on average hour-to-hour by month. I felt it was just a pretty graph to create but also informative. We have about 5 months of the year where the highs are consistently above average temp and 5 where they are consistently below average temp. With two months straddling the above/below quadrant. Anyway... I'm also working with some enhanced data from Flat Track Stats and looking to do some neat work with that soon as well.

Give me ideas people! I need things to visualize and make pretty!

Tuesday, March 10, 2015

JRDA Rankings (Unofficial) with Tableau Stories

WARNING! Big interactive graphs ahead! You probably want to look at it on a desktop or tablet and NOT your phone!


First off let me state that the views/rankings in this are NOT those of the JRDA but based on the JRDA by Junior Derby News. As some of you may know I coach an AWESOME group of Junior Roller Derby Skaters known as the Sixth Street Slammers here in Lexington, KY. Rankings from the JRDA only have one set available (Feb 2015) then I saw a post about Junior Derby News - The 4th Whistle and realized they had rankings going back at least 7 months. The current format started in September 2014 but stays pretty consistent. Anyway... on with the graphs!

Also a HUGE shout out to Aval Knievel from the Slammers for helping out with the data gathering! <3

Keep in mind that ONLY teams that are ranked (at any point) are represented in this data. 

Current Dates on these are: September 2014 - March 2015 (Current)


Sunday, February 15, 2015

Roller Derby Relationship and Gender Study Questionnaire

What’s this article about?
I'm writing up a little brief to answer some FAQs regarding my newly-published Roller Derby Relationship and Gender Study (located here: http://goo.gl/yF3Qr9 ). I'm looking at the way time spent in roller derby changes who we are, who we date, how we see our bodies, our self identity and some other key factors.

Who am I?!

IMAG0082.jpg


I'm a player/coach for the Men's Roller Derby of Kentucky team The Dark Horses and a coach of the Central Kentucky Junior Roller Derby team the Sixth Street Slammers as well as being a photographer for leagues all over the region and all over the world at several tournaments. In the real world though I do data analytics at the University of Kentucky.


The Story
The story is that this is actually v2.0 of a survey a friend of mine originally did who wanted to write an article about the results and asked for my help disseminating the original survey. I agreed to help her and she agreed to share the raw data with me to analyze once she closed the survey. The problem was she used free-form text entry on her survey which made it INCREDIBLY hard to classify/categorize!
Ex. “How long have you been involved in roller derby?”
“3 months”
“2.5 years”
“6 seasons”
“4”
You can see how this was problematic to analyze. My friend and original creator of the survey saw the terror she had wrought and decided that it wasn't worth sifting through to write an article about. Still, after about two weeks of working with the data I was able (literally after hand-coding around 600+ entries into categories) to get some analysis going. I couldn't deduce much but most of the findings were unsurprising. Most people do NOT change their gender preferences because of derby. What I DID notice in the original study though was that people that identified as anything other than "Straight" tended to 'come out' more while playing derby and reveal what they considered to be their 'true selves'. That made me VERY interested in expanding and refining the survey to make it much more nominal and more easy to analyze. I talked to my friend and she said it was my baby if I wanted it so I took it and have been refining it and trying to get it as inclusive as I could. I'm particularly interested in things regarding changes in gender identity/preference and the number of committed relationships people have and whom they have them with. Strangely enough in my early analysis of data from v2.0 survey I've found some interesting trends not related to gender and identity but just derby as a whole. Particularly that the average age of derby skaters seems to be (slightly) rising (see graph below).

Avg Age of People Starting Derby (Skaters).jpg


What am I going to do with all of this data?!
One of the big questions people ask is 'how does this help the derby community?' My big goal though is to dispel rumors and preconceived notions with cold hard facts and analytics. One of the common jokes around leagues I'm around is that when someone's marriage falls apart that "the Derby Divorce Machine" strikes again. While funny I was also curious if the rate of divorce was higher among derby than the general populous and try to deduce why etc. As far as where I intend to publish the information I run a data visualization blog at http://bourbonandbrains.blogspot.com/ where I'll likely publish some visualizations that people will be able to manipulate themselves and play with to find their own little nuggets of truth. The second phase of analysis is that one of my dear friends in derby is also a professor here at the University of Kentucky in Social Work and she asked if I could include some of the questions about comfort level with body image and sexuality in there to give it some 'umph' research-wise. She and I are hoping to write at least one, if not more, academic papers out of this data to publish out in some sociology journals.

Who has access to these results?
Ultimately only 2 people have direct access to these results and they will not be shared in any public way with email addresses (if you chose to put those down) or any sort of identifiable information. I'll likely be stripping out birthday as well since I've already used it to calculate "Age" and "Original Age When Joining Derby" based on the two date fields.

Finally
I'm very VERY excited about the amount of data coming in now and I've been making notes for refinements and I'll likely put out another survey of similar nature in about a year or so (to keep the data fresh, discover new data, and answer new questions and fix the survey for those with issues answering in a way that suits their lifestyles). I would still like more international participation and participation from skaters 21 and younger (even down to 15-16) but that requires tapping into a demographic that uses things like instagram and snapchat where it's really hard to deliver a survey link! :-/ If anyone can think of a good way to get to this younger demographic I would LOVE to hear about it!
I'm more than happy to answer any questions or concerns anyone has so please send them my way via my email at inform8n@gmail.com or on twitter @wjking0 I want us to better understand ourselves as a derby culture and improve ourselves through self-knowledge.

Much derby <3,

P.S. Any site is allowed to reproduce or publish this page as along as a link to this original article is included.

Monday, February 9, 2015

Where's Waldo?! A Search Algorithm!


I have been feverishly working on a few HUGE viz's coming up so in the meantime I wanted to share something I thought was super fun (if childhood spoiling). A Where's Waldo search algorithm!

Here is the link to the work which is pretty awesome:
http://www.randalolson.com/2015/02/03/heres-waldo-computing-the-optimal-search-strategy-for-finding-waldo/

And here is something to check out to tide you over until my other big Viz's are complete!


Thursday, January 8, 2015

G.I. Joe Figure Viz (because I had a weird dream)...


Do you ever have one of those dreams that feels SUPER real? I had one of those the other night. Ironically I was dreaming about hanging out with my old friend James and his wife and newborn when James was asking me about my new data collection methods. Then (in my dream) he surprisingly asked, "Oh my god can you index GI Joe figures too!?" "Umm... sure, I guess," I replied.

James (on his B-day) and his cute daughter! =)


I then woke up to find out James birthday was literally the next day. I poked around trying to find a nice GI Joe DB (because I figured if I dreamed about it I should probably do that!). I came across www.yojoe.com which has a really great database of Joe's located here: http://www.yojoe.com/action/

I did a quick scrape and got to work playing around, the most interesting thing to me is the "Haves/Wants/Sales"... NO ONE is selling their 1980's Joes... the 90's ones are WAY more fair game. =)  Anyway, because I had a dream and I hadn't published a viz in a while I wanted to just kick this one out while I put the polish on a few others I'm working on that will be more in depth. So here ya go, my birthday present for my friend who never really asked for it on his birthday because I had a dream (if that isn't all confusing enough!)!


As always if you have any comments/suggestions hit me up on twitter @wjking0.