Monday, December 15, 2014

ThinkGeek Catalog Details Data Analysis (What's on SALE!?)

It's time once again for some holiday shopping! I'm assuming if you're reading this blog you're probably of the nerdy variety so you'll probably appreciate the same kinds of things that I do in a consumer sense.

Import.io LogoSo I got thinking about where fun places to buy things are. I've recently fallen desperately in LOOOOOVE with Import.io. I'd been playing with a few little data scrapes but I finally decided to put it through some real paces now that I understood better how to train it and analyze the data after-the-fact.

Ah-Ha ThinkGeek! I'll scrape their entire catalog to see what to get for people!


ThinkGeek Logo


A quick scrape (well 4 hours later) we have a total of 3,930 products in our dataset. In the following categories:


  • Computer Stuff
  • Electronics
  • Electronics & Gadgets
  • Gadgets
  • Geek Kids
  • Geek Toys
  • Home & Office
  • Interests
  • T-Shirts & Apparel
  • Tools Outdoor & Survival


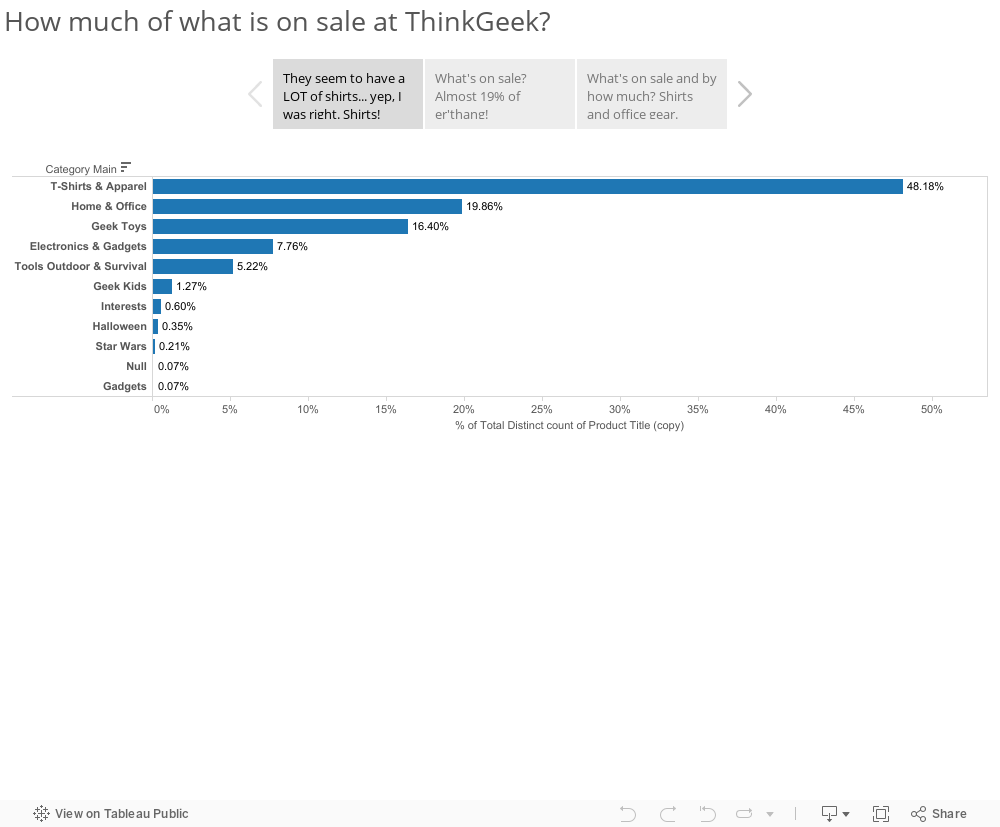
I decided to do sales data two different ways, first was to do sales percentage difference. That is to say the percentage off of the full price in a category (color depth denotes number of products in a category):


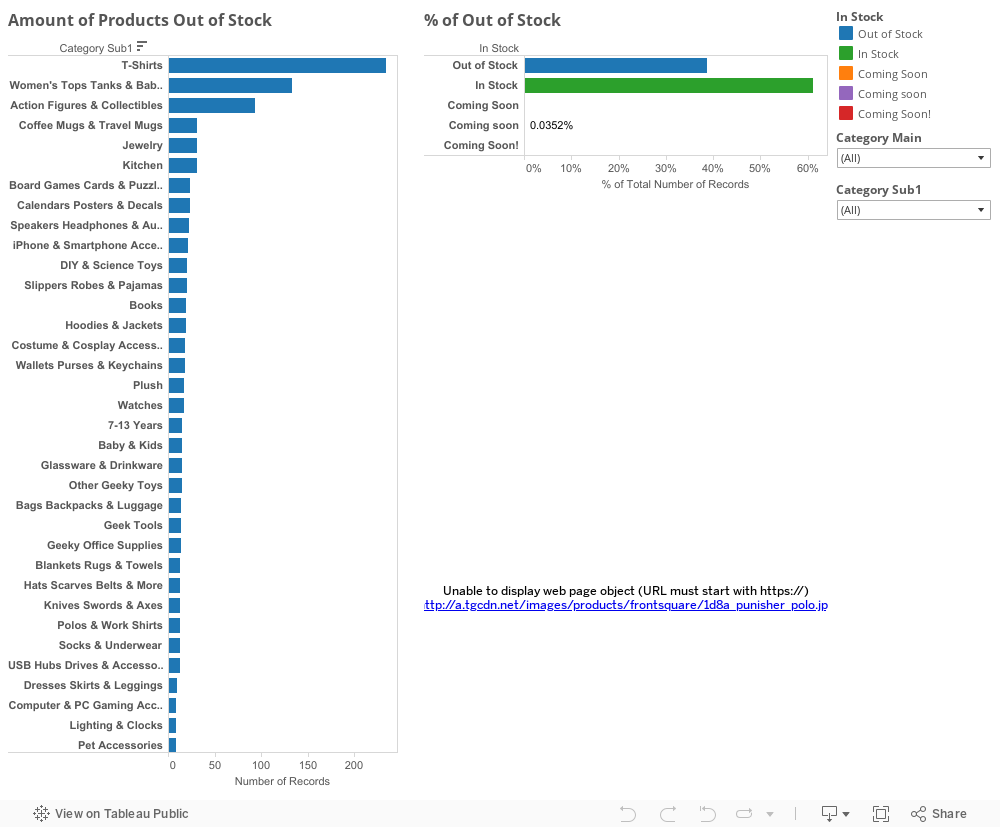
Finally the big payoff! Scroll over a product to load the product image and click on a product to load the product webpage (be careful not to scroll across another product after selecting one or another product image will load on top and thwart your shopping efforts!):


Let me know what other retail sites you'd like to see analyzed and I'll see what I can do!

Lastly I figured I'd show the amount of stuff that was out of stock at ThinkGeek which I found to be exceedingly high as well (a full 46% of their total inventory!).


Thursday, December 4, 2014

Crosswalk Data - A Lesson in Finding Exactly What You're Looking For

I enjoy a nice Fall (or even early Winter) walk. I live in the beautiful and vibrant city of Lexington KY. It's a largely urban city so I spend a lot of time crossing crosswalks. Crosswalks have a numerical countdown... I love number problems!


Times obviously weren't a set number so either they're set randomly by whomever is setting them up or there is a pattern. I figured it had something to do with the account of traffic in an intersection (cars/hr or something equivalent). I started looking in the usual places for the stoplight/crosswalk light information I was looking for /r/datasets, data.gov, etc. It wasn't until I started glancing into city municipal data for various larger cities that I discovered that the math was already done for me!

T = d/1.065
T = Crosswalk time in seconds
d = Distance in meters

The 1.065 m/s (3.5 ft/s) comes from a study done in 1982 regarding mobility of pedestrians. Generally speaking the speed of the average pedestrians is around 1.22 m/s but a longer time is factored for walking speed to give time to elderly walkers and pedestrians with mobility disabilities (which accounts for about 15% of the population). So now every time you cross a street you can think to yourself how long the crosswalk (and thusly stoplight) SHOULD be and be able to roughly calculate if that's accurate!


Now given the dataset that I just got access to the other day (upcoming viz VERY soon, I promise) I'm now wondering if I could time it based on light changes to walk to work hitting every single crosswalk at the correct time based on the distance between lights, crosswalk distance, and light timing. It's moments like this that I think I'm steadily becoming this guy:


Like I said, new viz regarding stop light data is coming very soon... 

* Most of the municipal data for this post is pulled from this site: http://www.fhwa.dot.gov/environment/bicycle_pedestrian/publications/sidewalk2/sidewalks208.cfm