Tuesday, September 23, 2014

WRFL 88.1 FM Lexington, KY MP3 File Breakdown

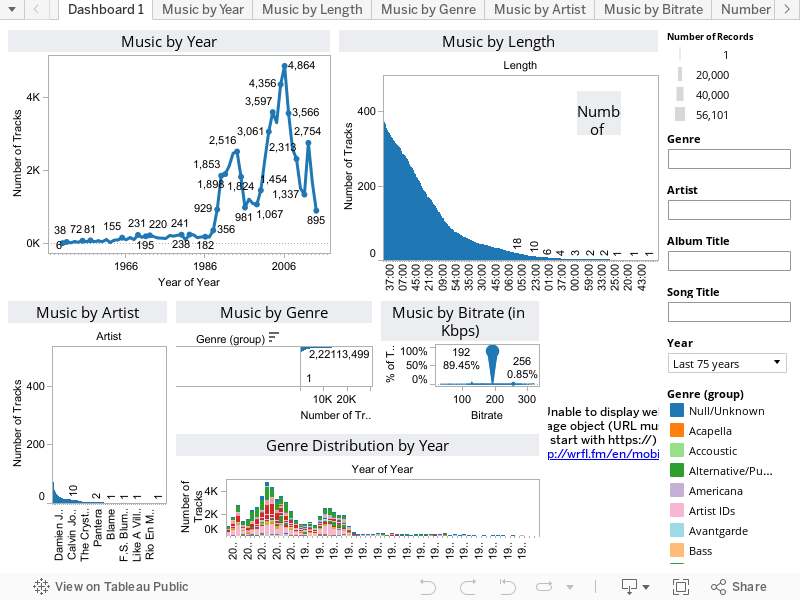
WARNING! Ultra-WIDE #DataViz Ahead!!!


While I'm not making #DataViz out of #WeirdData I work as a Sys Admin for the University of Kentucky. One of the most neat and data-rich departments I get to support is our student-run radio station WRFL 88.1 FM. There are over 300,000 MP3 files stored on their server from their over 30,000 CDs and well over 30,000 vinyl records. At this point a good chunk of the CDs have been ripped and provides us with a rich dataset. It allows us to ask all sorts of neat questions of a unique set of data:


  • Want to know the average length of a Rock song? 3 minutes, 23 seconds
  • How many songs on the server have the word "Kentucky" in the title? 57
  • How many songs does Johnny Cash have on the server? 916

All that being said, I know that this data (because radio station employees can upload their own data to it) is not the most "clean" set of data. Do I believe there was a song from 1675 on the server? Probably not. Eventually also I'll clean up the "Genre" category a lot more over time. I expect I'll be updating this particular dataset somewhere in the 4-6 month range.

ALSO! I was going to throw in a logo and decided instead to throw a live-stream player built into the DataViz which refreshes when the track playing changes allowing people to search out that particular artist/album to see what else is there.


Let me know what you think and suggestions for how to improve the viz at @wjking0.


Friday, September 19, 2014

Where (Not) To Eat In Lexington, KY

I got this data from the Lexington, KY Health Department and while I hoped to have this constantly update-able I don't know that is going to be the case. I had to do quite a bit of data-teasing before I could actually do some work (particularly with location data). Additionally I had to create a file that contained all the Health Code violations and definitions so I knew which were "Critical" violations and what each code means. So this may be a one-off data viz.

I wanted to look originally if zip-code (and thusly socio-economic status) of an area had anything to do with food quality but I quickly realized another trend. That "Marts" and grocery stores tended to fall towards the end of the spectrum. Also interestingly every "school" is listed as well... use the search function to search for schools or other clusters of dining places to see if you notice any trends and you can shoot me a message @wjking0!

Search or click on the map and drag to select multiple locations and scroll down for more info about your selection!


Wednesday, September 17, 2014

Kentucky Derby Winners Viz

After attending #Data14 the Tableau Conference it came to my attention after a session from Jewel and Crew that I should start sharing out all my #WeirdData that I enjoy viz'ing? I hemmed and hawwed about what kind of viz to do so I figured I would start with one from Kentucky (my current home). Here in Kentucky we love three things above all else... Basketball, Bourbon, and Horse Racing.

The Kentucky Derby is one of the oldest continually running horse races in the world. The data set there is pretty expansive but I was amazed at how hard it was to find. The data I ended up using I scraped from a couple Wiki's and I have some other data that I may enhance this with later (such as Purse collected). For now though enjoy playing with my first ever blog post and my first ever Tableau Public Viz. Comments/suggestions welcome! @wjking0