
As a non-native Kentuckian I wasn't sure what WIC usage looked like in this state. My assumption was generally that WIC was something you'd see more of in large developed cities. It turns out I was wrong.
The data used came from the following:
- RAW WIC Data for Kentucky: http://datacenter.kidscount.org/rawdata.axd?ind=1299&loc=19
- Total Population Numbers came from the 2000 and 2010 census.
For the calculations I applied the numbers to total calculation and not to subgroups for women or children under 18 so usage percentages for those may be higher but I don't have the WIC info regarding numbers of mothers vs children utilizing services so I didn't want to further muddy the numbers.
Also for these calculations I applied the 2000 census amounts to the 2000 WIC numbers and then for the 2006-2013 WIC numbers I used the closer 2010 census numbers as populations estimates for most regions were fairly stable over that time period.
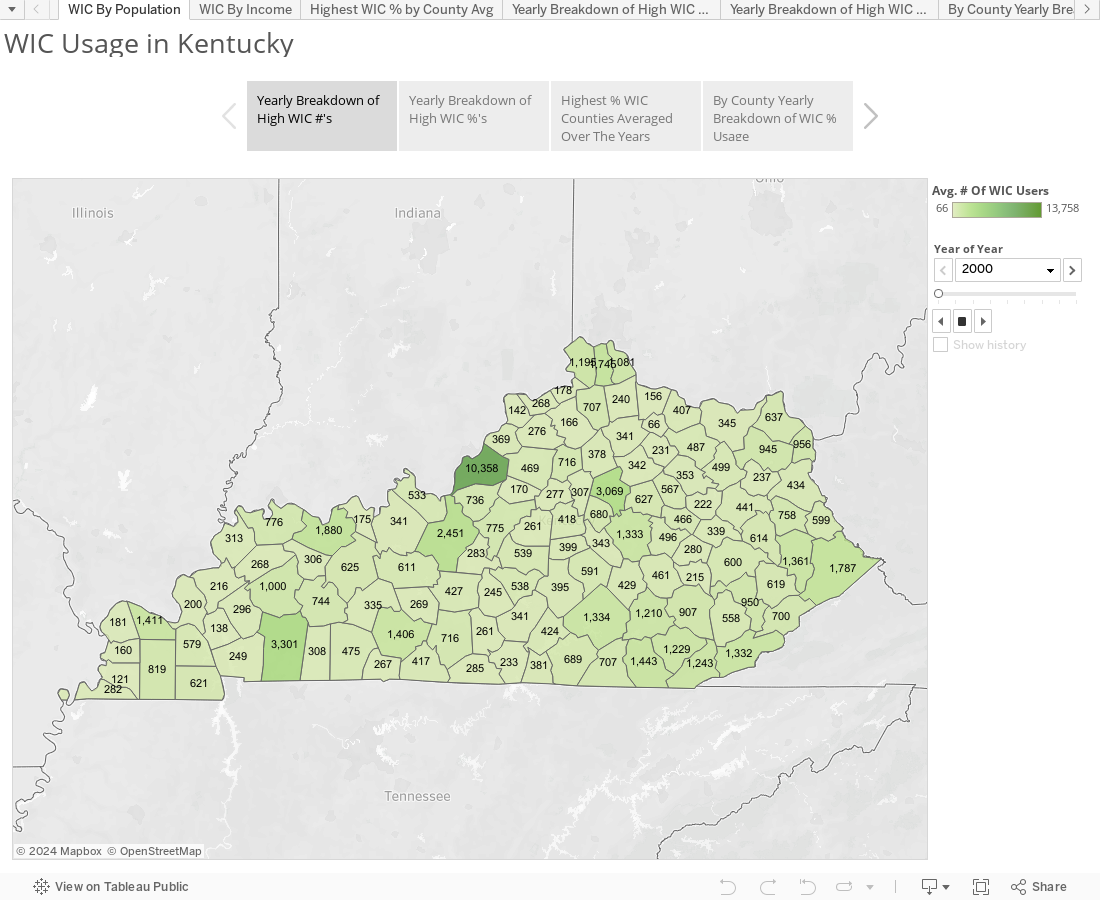
As you can see, the large urban areas of Lexington and Louisville (Fayette and Jefferson Counties respectively) have fairly low usages of WIC (<2%) while areas particularly in eastern KY you can see have fairly high/consistent usage. I haven't done cost analysis yet but once the USDA fixes their website and I can get some more in-depth numbers I should have some more data to play with.
As usual hit me up at @wjking0 if you have any questions or concerns or just want to talk about public data!
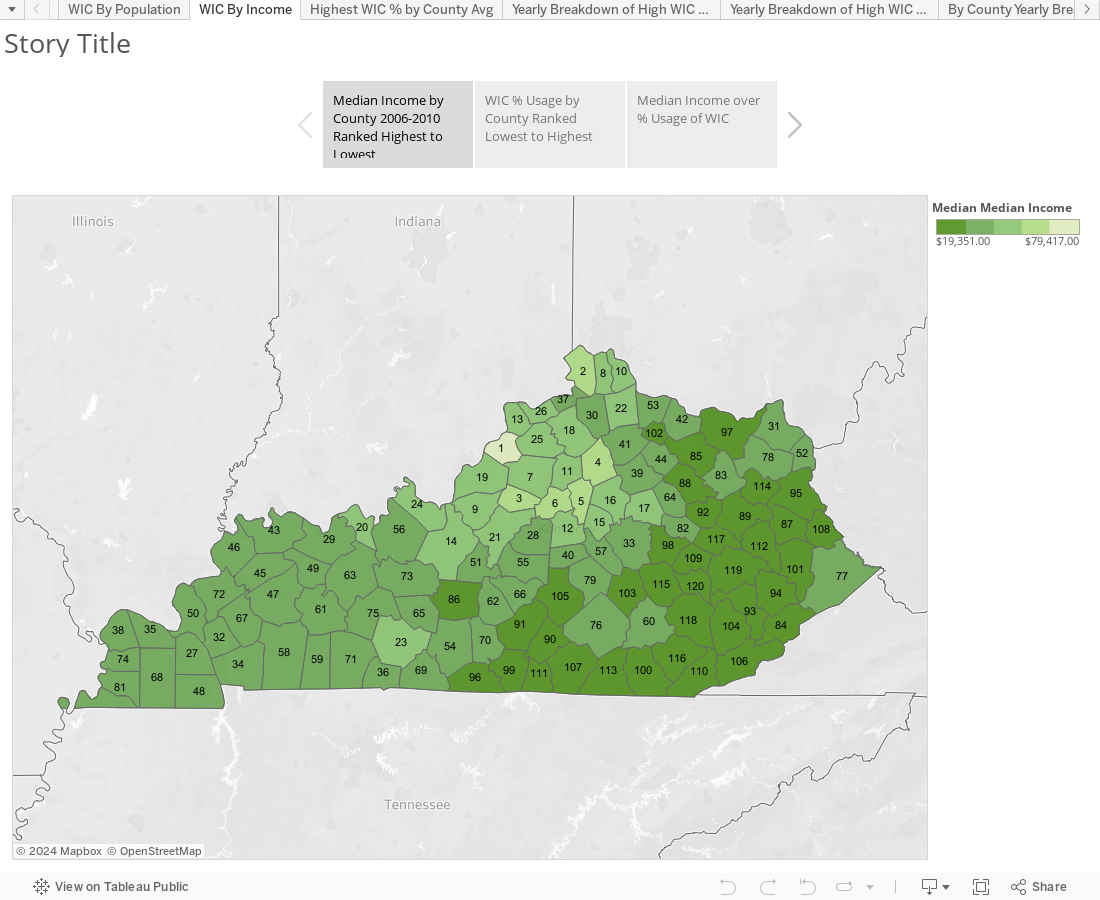
EDIT: I've added the second dashboard/story as there was a request to look at the comparison of WIC % to Median Household Income so I crunched that out real quick:
No comments:
Post a Comment