Monday, June 27, 2016

Instagram In My Hood (1 Year of EVERYONE's Lexington, KY Instagram Posts)


PREFACE: This page contains LARGE-SCALE dataviz! It will NOT work on your phone! Walk or run to a desktop/laptop/tablet computer to view the dataviz properly formatted!

A little over a year ago I came across an amazing IFTTT (If This Then That) recipe for "Instagram in My Hood" and I thought "well I'm going to look at this just for the name..." and what I found was fantastic! It was an IFTTT recipe for cataloging ALL the geo-tagged Instagram posts within a region!

UNfortunately, Instagram's usage policy changed and now those location-based IFTTT recipes will no longer function due to changes in their API. BOOOO! =/

When I checked to see what all I'd gathered since turning it on I found it had run from March 26th, 2015 until June 1st, 2016 so a GOOD chunk of data! Of course I would have like to have run it multiple years to see if trends change or if predictors held true but alas, that's not the world we live in. Instead I can show you when and where certain people talk about certain things in Lexington!

Let's talk for a second about what this data IS:

  • PUBLIC Instagram posts
  • GEO-LOCATED posts
  • Limited to WITHIN New Circle Road in Lexington, KY (this was approximately the limit on the area I could cover with the IFTTT Instagram API call).

What the data is NOT:
  • PRIVATE Instagram posts
  • NON GEO-LOCATED posts
Interestingly enough if you choose to geo-tag an Instagram post that makes it public regardless of settings (essentially because you are "tagging" a place). 

First let's look at posts over time and by hour-of-day and day of week. Please note that the days where there are only 6-10 posts are ones where Instagram and IFTTT had some technical glitches. Also notice that if you're interested in a particular hashtag or word you can search the text content of the Instagram posts to look for frequency with the search bar on the right of this viz screen.


You can see that (as you would expect) Friday, Saturday, Sunday are the largest post days-of-the-week but I thought Thursday (because of Thursday Night Live) might actually be the next highest day-of-week. Surprisingly the next highest is actually Tuesday for some reason! I haven't done a deeper dive into the data to figure out why yet. If anyone has any suggestions let me know!

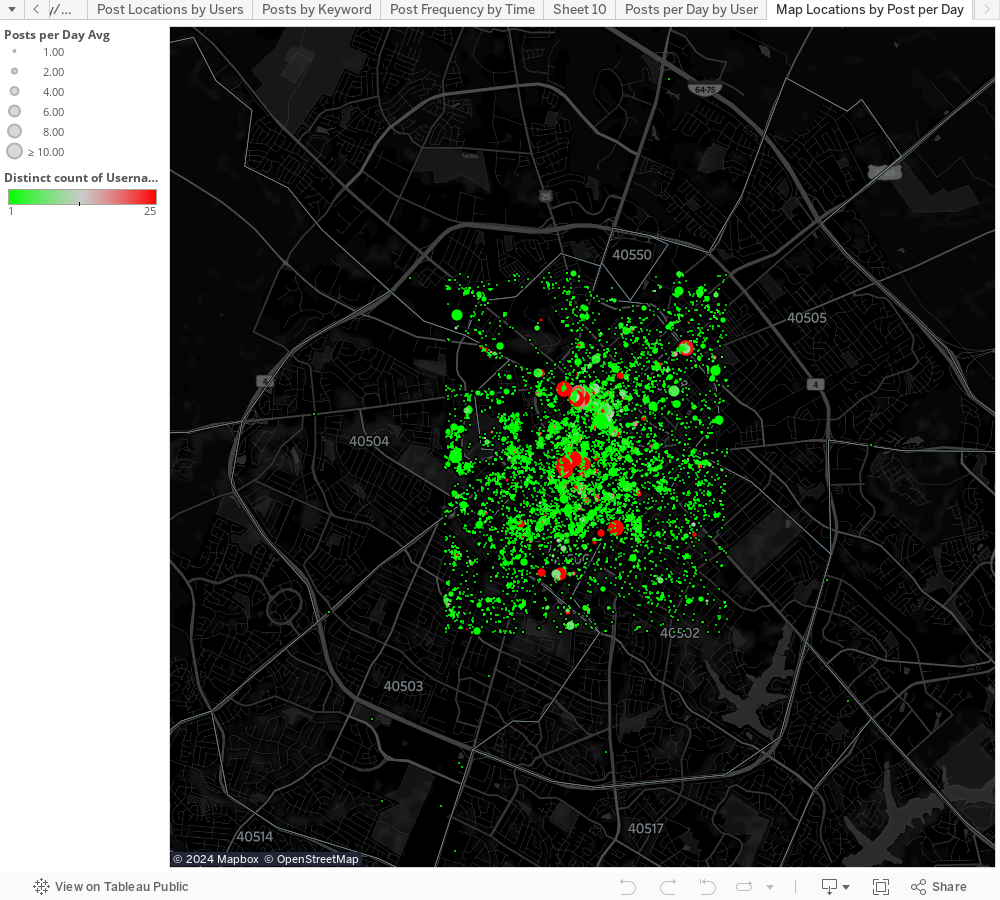
I realized that I could figure out the average posts-per day for a place but I realized that there were some places that had tons of posts per day (I'm looking at you Wild Fig! ;-) ) but I decided to scale the size of the dot on the following image to the number of posts per day and then use the count of distinct users to help bring a "pop" to the places where there are actually large numbers of different users talking about/from.


The next thing I looked at is WHO is posting and where do particular users post from the most?

I know this is a little messy but given the number of users I wanted some color variation (highlighting didn't seem to work as well without it). You can enter a username or select from the list of names below sorted by most frequent posters. If you mouse-over the name or the bar representing their number of posts it will show you a highlight on the map of all the places that particular user posts from around Lexington.


Finally I replicated some of the functionality of Instagram's search by doing a text search as well as adding mapped locations where that thing is mentioned. Below you can see "Beer" as the search term and you'll notice it coordinates to bars but more specifically breweries in Lexington! Imagine if you could do this globally with Instagram and you could find the most talked about bars in a town!


As always if you have any questions about this dataviz or any other please feel free to hit me up on twitter @wjking0

And also this is totally how I feel when I spend the majority of my birthday writing up dataviz blog posts, playing video games, and eating donuts from the awesome North Lime Coffee and Donuts. =D
<------

Thursday, June 2, 2016

Kentucky School Vaccination Rates (2015)


Let's talk about vaccines. First off, I'm NOT going to have a debate about how effective or dangerous vaccines are. They're both effective AND safe. I've crunched the numbers for the amount of things like mercury (Thimerosal actually) contained in vaccines and basically if you've eaten fish in the last year or two you've consumed more actual mercury than in all your childhood vaccines combined.

OK, now that we're done with that... let's talk about vaccination rates! Contrary to popular belief MOST of the world is vaccinated!
Rates of measles vaccination worldwide
Turns out that even in super-rural and third-world countries people will travel great distances to get their children vaccinated.

I stumbled across the Student Health Data provided by the Kentucky Department of Education and thought, "Man, I wonder how many kids in this state go unvaccinated?" For those with other questions such as what the average BMI of school kids of different grades in different counties are etc.

Turns out more kids are vaccinated than I expected when I started crunching through the data! Good job Bluegrass! To let you know how these numbers were calculated I used the enrollment number of each school and just did a little division with the other variables represented. No fancy-dancy math needed here! To be clear the data comes from the 2015 school year.

The classification for the numbers you're going to see here may need a little defining.


  • "Grade"
    • 0 = 5-6 years old 'Preschool' (pre-1st Grade)
    • 6 = 12-13 years old 'Middle School' age
  • Vaccinated Definitions
    • 'Vaccinated' = Fully Vaccinated and Up-To-Date on Boosters
    • 'Non-Vaccinated Missing' = No Vaccines and No Boosters
    • 'Non-Vaccinated Expired' = Previously Vaccinated but did not receive booster shots
    • 'Non-Vaccinated Religious' = Vaccinations not applied for "religious reasons"
    • 'Non-Vaccinated Medical' = Vaccinations should not be applied to these individuals likely because of immuno-compromising diseases or treatments (such as AIDs or chemotherapy)
    • 'Non-Vaccinated Provisional' = Vaccines may not be completely up-to-date and/or may be being delivered at a staggered rate for medical reasons but are planning to be delivered on a particular schedule.
  • "In/Out of Independent School"
    • In = Independent/Private School System
    • Out = Public School System
  • "District"
    • For most senses this is represented as the county in which the school resides but excludes Independent School systems

Let's jump right in to the data!


For those of you who would prefer a sort-able list to see where your county falls in the scheme of things you can also use the following Tableau Story to click through... also feel free to click around and sort any of these fields you would like to!


I know there's not a ton of interactivity on these Viz's nor a lot of differentiation but I wanted to just share that the percentage of immunizations in KY was surprising to me. The big thing is that there are preventable things happening in regards to immunizations in children which could easily be preventable. The prime thing is keeping children current on vaccines.

The trend in the data from my perspective is that In almost every other category

To summarize here are a few things I found interesting:

  • The majority of KY children who are susceptible to these types of infections are ones who have not received booster shots so they fall into the "Expired" vaccine category
    • The largest change in any group is in the "Expired" group
    • The increase in students from grades 0-6 is about 4.869% in lack of updated booster shots
  • In virtually EVERY other category (save Provisional which increases by 0.010%) all other reasons for non-vaccination go down rather drastically between grades 0-6
  • Looking at the difference between Independent (private) and Public schools I saw very little difference on most issues and didn't feel it was relevant to look at it with this differentiation included. A few things worth noting:
    • Independent schools do start with a higher average of students with religious and provisional exceptions
    • By grade 6 stay Independents retain almost exactly the same % of vaccinated students
      • Expired %s go way up (3x approximately)
      • Missing and Religious %s go down
  • The data in some places is missing a fairly large number of students
  • Bell and Bath Counties all are VERY low as far as full vaccination rates (this could be because of missing data, which we have to count as a loss)
  • Breathitt County has 15.8% of their students non-vaccinated due to legitimate medical reasons


Places like Breathitt County are the reason that the idea of herd immunity is very important! Unfortunately the rest of their stats aren't looking very good either, the big problem is the total number of enrollment there is very low so the likelihood that those immuno-compromised students will interact with non-vaccinated students is very high. Finally I just wanted to share out with you this little gif explaining why herd immunity is important in protecting people:

As always for comments or questions comment below or hit me up at @wjking0 on Twitter!