This is the longer/more-boring version of the shortened article here: http://bourbonandbrains.blogspot.com/2018/02/university-of-kentucky-crimes-mapped.html
One thing kept nagging at me though and that was a project I started years ago while I was still working at UK. Here's the quick story... I worked in the Division of Student Affairs for the last 15 or so years of my employment with the University. Years and YEARS ago I thought that the way we reported crimes on campus was ridiculous. Due to both federal and state laws (known as Clery/Minger laws) the University has to report all crimes and acts of arson on campus. That is currently done in the following format:
Now, I don't know about you but while that fulfills the "letter of the law" I don't feel it fulfills the "spirit" of the law. Those laws were done so people could educate themselves on crime and trends to determine their (or their child's) safety on a college campus. I went to my boss at the time telling her I'd like to get a group together to map out crime on campus to help places like our Violence Intervention Center and other places focus efforts and overall to make campus a more safe place. I was told, in no uncertain terms, that I was not to do that. The fear was that it would "reflect poorly on our Greek community." (Which, once I looked at the data, it doesn't actually!) This, of course, pissed me off. I didn't have the tools to do it on my own... fast forward a few years and I became one of the Tableau super-users on campus and I realize that I now have all the tools (data scraping) and knowledge of data visualization (Tableau) to do this whole project myself. I went to my boss at the time, a different VP who was more forward thinking (Dr. Robert Mock) and let him know that I had gathered this data, analyzed it, and I was going to publish it. I let him know (as with now) I did it all on my own time with my own resources from publicly available data and I wasn't so much asking permission as I was just letting him know I might be kicking a hornet's nest. He told me to contact the UK Police and let them know what I'd done before I publish it... so I did. I wanted to show the police what I'd done and give them a chance to weigh in. I met MULTIPLE times with the then Lt. Barefoot (I believe Captain Barefoot now) and when I showed him the data he wasn't at all surprised. He helped clear up some of my understanding of the data and was SUPER HELPFUL. I can't speak highly enough of all the University of Kentucky Police Department. Seriously, they're great and very forward thinking.
One of the first things they asked me was if I could do this data live against their database, which I was THRILLED to hear. I worked on a version to be published publicly and running against their database they were using to display on the Crime Log page. Unfortunately this project got bogged down in minutia primarily regarding updating map coordinates. I heard whispers up until about a year ago that someone was still going to publish/maintain it but without me driving the issue it ultimately never happened... UNTIL NOW!
This data is hand-entered into a system so you can imagine with 16000+ rows there is a lot of fat-fingering errors that happen. Additionally the text parsing to clean the addresses was a NIGHTMARE. Basically what I did was find every way to say "RD" and every permeation of every street ending you can imagine and did a huge if/then to combine all those. Took away the punctuation from everything and ended up hand-geocoding most of it with the AH-MAZE-ZING service Geocodio.
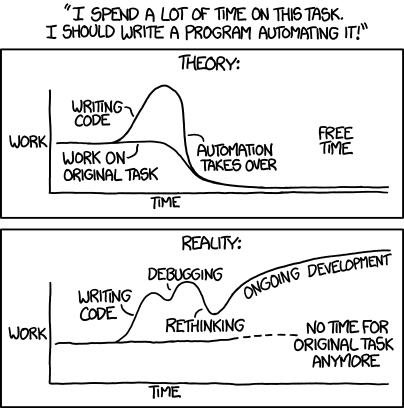
After that I tried to go in and manually include building names where the addresses matched. I considered doing this problematically but honestly it would have taken about the same amount of time either way. Whenever faced with a big problem like that I always like to refer to this XKCD comic:
Anyway... those are the gory details of why I did all this and how I did it. Just as before this data could be presented in this way live but it has never been made a priority by the University. Given the nature of some of the things that have happened recently maybe things like Terroristic Threatening should get a little more of a spotlight shown on it.
As always if you have any questions/comments/concerns hit me up on twitter @wjking0.


No comments:
Post a Comment