Since the 2014-2015 University of Kentucky Salary Viz was such a hit I figured I would both redo and improve some of the fancy stuff I did previously. First off let me say that I work at the University and have for quite some time. I've loved my work and the people I work for, I also think that everyone should watch this video (embedded below) first before wanting to be super-secretive about what they make:
After the last time I presented this data several emails went around UK regarding if I had done anything illegal in creating these viz's. Soon afterwards I actually met with UK Human Resources (who were extremely nice by the way) to talk about ways to get this info in a more "live" format for them to use. To be able to do quick assessments on medians and averages for different position levels or departments was apparently something they'd been striving to do for about 2 years. Even going so far as to hire a person specifically for the development of that kind of system. I ended up meeting with them and discussing the idea of developing a live version using our UK Tableau server but never really heard much back after the initial meeting. Anyway... the upshot was, I didn't get in trouble as that one (like this one) was done on my own equipment, on my own time, using publicly available data.
NOW, on with the viz!
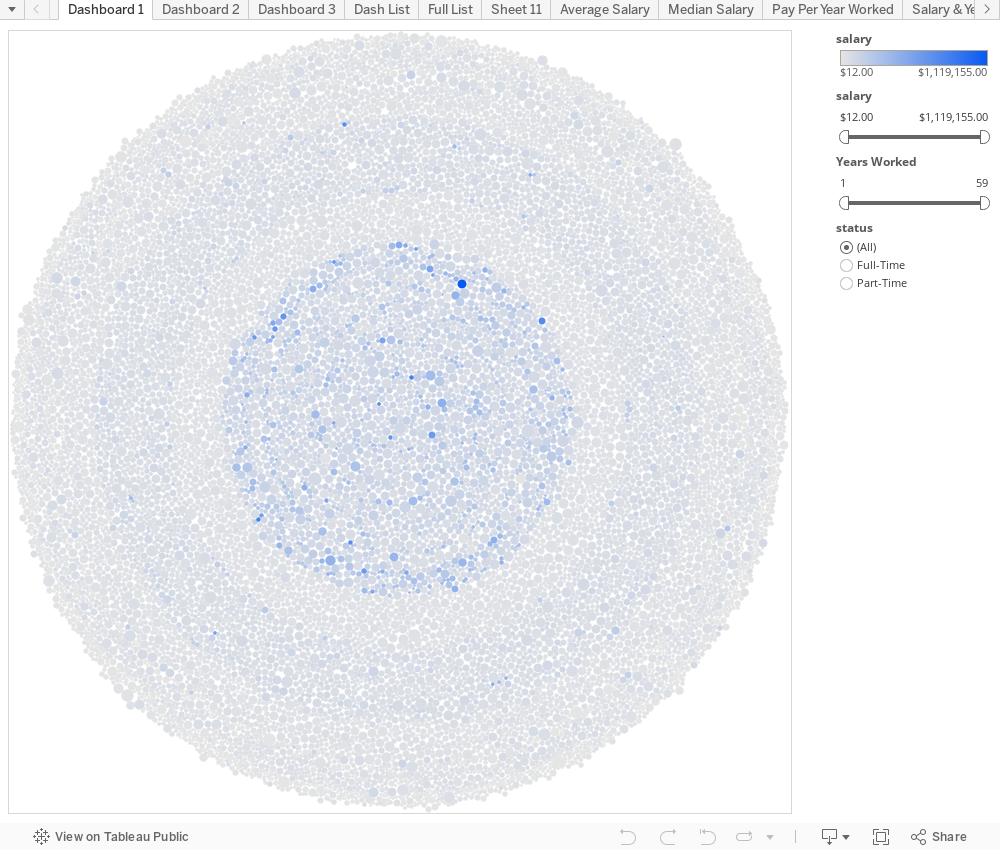
The three graphs you'll recognize from last year but I also squashed several bugs. The first is the bubble graph showing all salaries and years worked. Years worked is represented by the size of the circle and salaries is the richness of the blue coloring.
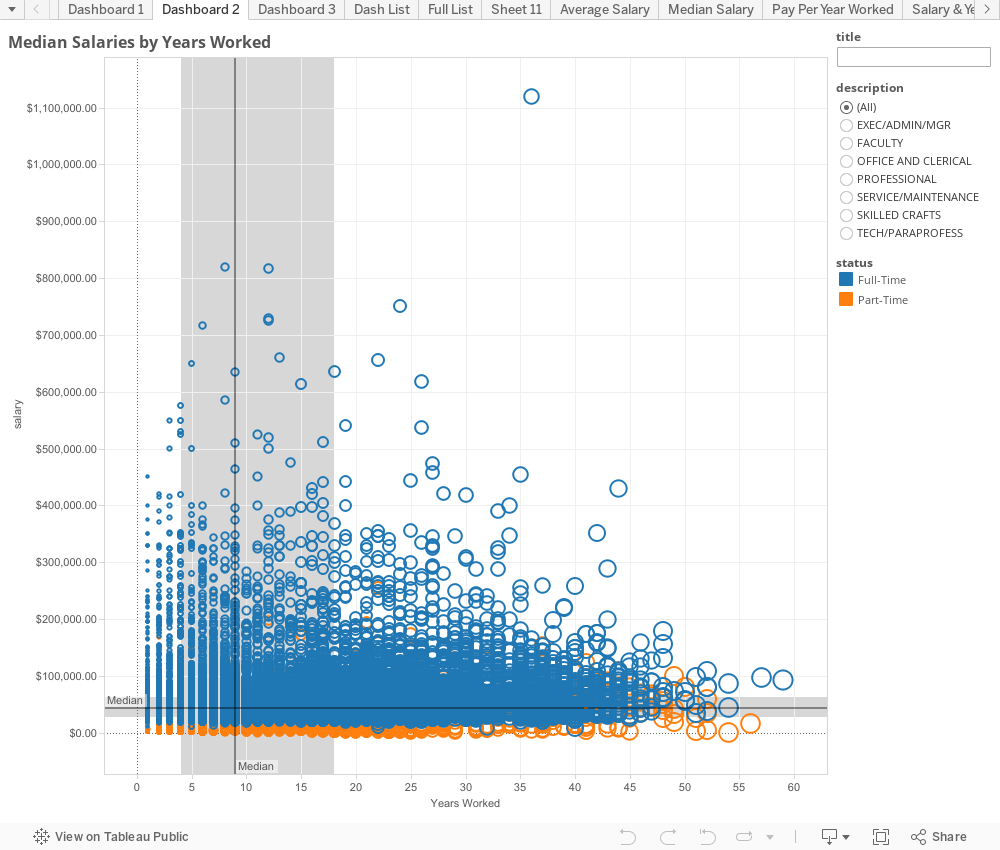
Next I wanted to establish medians with quartiles for both years worked and salary. At about 17 years now I'm in the upper threshold of the quartile for years worked and hovering just over the median salary at UK.
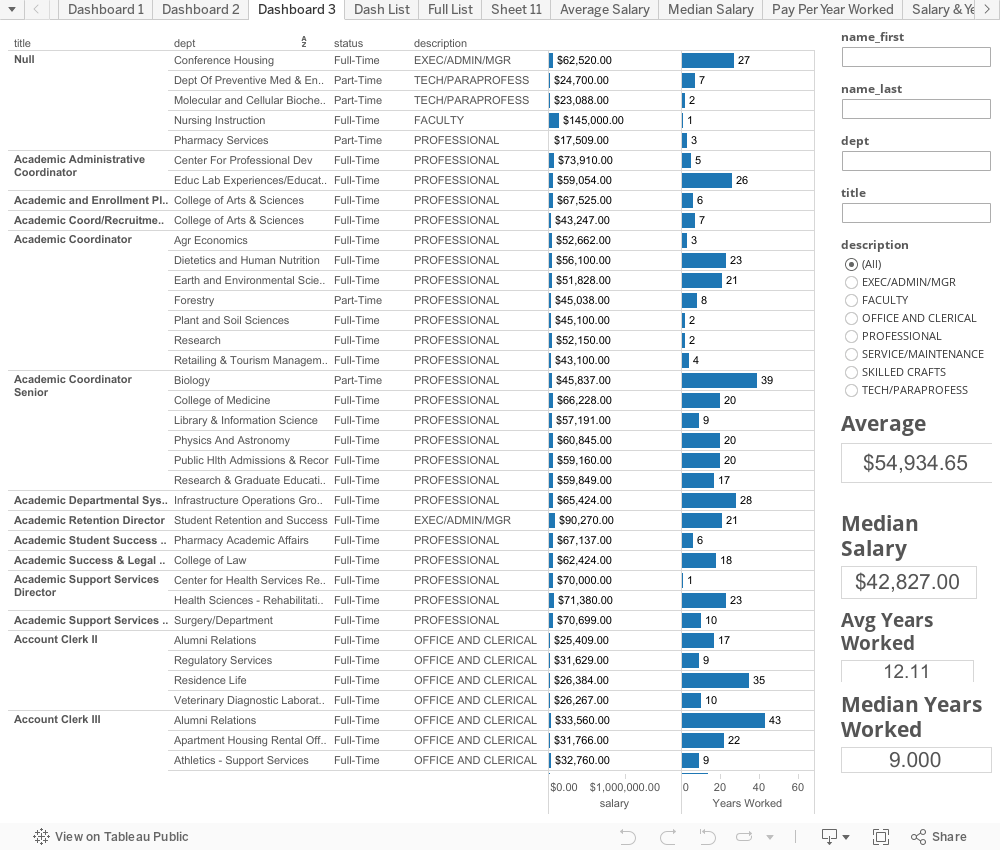
Third is the big "full list" of salaries that you can scroll through. It's sorted by position (aka "job title") and then Department, Full-Time or Part-Time, then "Rank" (which only applies to faculty so there is a rank of 'non-faculty' for everyone else), Salary, and the number of Years Worked. I sorted it by position because if you hover the mouse over the Position the info on the right (medians and averages for years worked and salaries) will change to reflect the job title you're exploring.
Now comes the big one... the one that I know a lot of people have waited over a year for. What can you calculate when you have TWO years of salary data? Raise percentages. The BIG THINGS to keep in mind here is that when calculating these I made sure the people met the following criteria:
- In the same Department as 2014-2015 data
- In the same Position as 2014-2015 data
- In the same Full-Time/Part-Time status as 2014-2015 data
- In the same Exempt/Non-Exempt status as 2014-2015 data
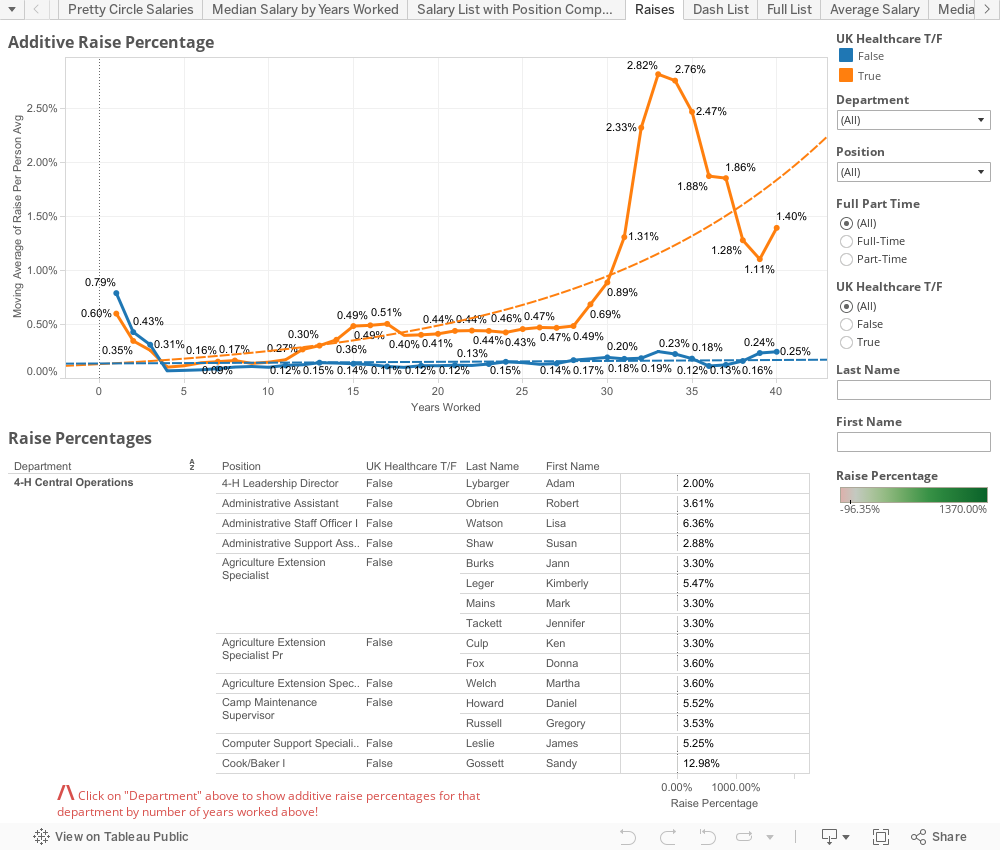
The other thing I thought about was if there was any discrepancy to raise % by the number of years worked. IE is there a good-ole-boy system at play that rewards people who stick around longer? The short answer to that is not particularly, pay rates DO go up over years but that's to be expected, raise percentages don't tend to increase that much as you go up the scale (and remember the "scale" we're looking at is over 40+ years in length of service). The one noticeable trend I did see was that, over time, raises at the Medical Center side of campus tended to add up to larger amounts. You'll see the orange line at the top of this dashboard represents a MOVING AVERAGE of raise percentages. This is generally pretty low because there are LOT of people, particularly when you include part-timers, that receive 0% raises.
You'll notice the list of raise percentages is very similar to the median/averages for salary/years worked from the other dashboard but the primary sorting field is now department so you can click on a particular department and see how raises have been handled by the number of years worked. Obviously, when you have such few numbers you'll notice that the moving averages tend to shift pretty severely... still, if you select a department with hundreds of people you can get a pretty good idea on what the financial upward mobility looks like there.
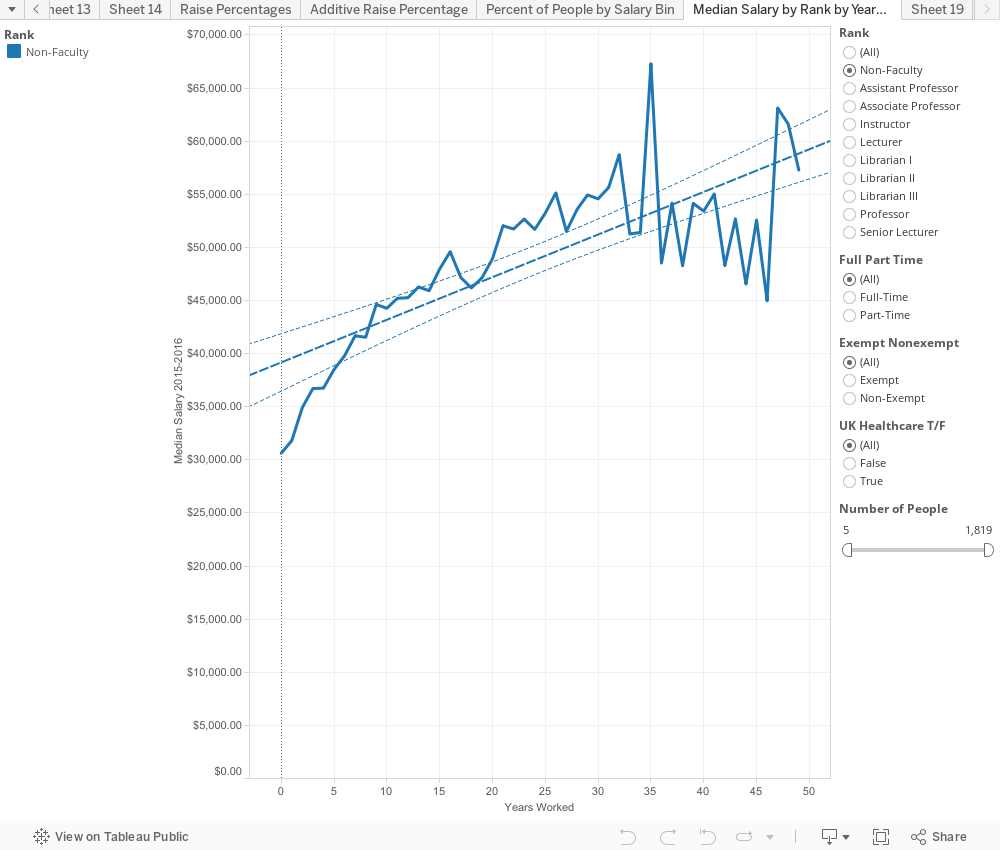
This last little one is just to give you median's by "Rank" (faculty/non-faculty) over time. To keep the graph at least someone accurate and smooth it out a little I limited it to at least 5 people with that particular number of years worked. You can bump the slider up to 10 if you'd like a little more accurate picture.
Ultimately though the university spends $1,137,609,613.91 on Salaries according to their released data for the 2015-2016 fiscal year. While that may seem like a METRIC TON of money (and it is), think that the University of Kentucky is also one of the single largest employers in the state of Kentucky. It's the flagship university of the state of Kentucky. And sadly while none of us working here will ever be like the guy picture below, it's nice to know where state money is going and to know (now that we can calculate raise percentages and have historical data) that nothing crazy is going on.

Lastly I'd like to make this data as available as possible so you can obtain all the data used in this here: https://goo.gl/S8fVTc
As always you can hit me up in the comments below or on twitter @wjking0