Showing posts with label #WeirdData. Show all posts

Friday, March 17, 2017

Urban Dictionary - Top Words (NSFW Text!)


This is part of my #1YearOfViz series! Check out the archive here: http://bourbonandbrains.blogspot.com/p/one-year-of-dataviz.html

WARNING! If you're offended by "bad" language steer clear of this viz!


Originally this week I was going to work on a viz about Girl Scout Cookies.... I was hoping to find some sales numbers... then after some brief searches I realized that was a pretty fruitless endeavor and the closest I could come was looking at the google trends for the different Girl Scout Cookie names. While interesting... isn't exactly dataviz worthy.


So switching out from the totally mundane and safe for work topic of Girl Scout Cookies (THIN MINTS FOREVER!)... I flipped my mindset entirely and decided to look at Urban Dictionary. I was thinking back to an article that I read about when IBM's Watson was fed Urban Dictionary to help learn slang and ended up having to have it purged as the AI wouldn't stop swearing as part of it's normal speech pattern.

I considered attempting to scrape it but wasn't sure how large a scrape that would be... when low and behold I found someone had already done the work for me! Huzzah!
I'm too lazy to scrape that much data!
I've compiled some quick facts I've learned about words... which is a hilarious sentence to write. I'll link to sources when there was one otherwise it was something I learned through the analysis of the data:
  • Merriam-Webster 

  • Urban Dictionary 
    • Avg 1.277 definitions per word
    • Avg word length 10.05 letters
    • Median word length 9 letters
    • Total number of definitions is 2,079,261
      • This contains phrases as well as words
    • 1,457,980 Unique Words/Phrases

Before we actually get into the data remember that I just manipulated the data into the viz and am not the author of any of this. If you're easily offended by slurs or bad words... now would be the time to check out another viz!

I limited the whole viz to the top 10,000 words/phrases by their sum difference between their Upvotes and Downvotes. Some had multiple definitions and so the list looks slightly different if we use Total instead of Average for the Up/Down difference (in that instance "Sex" becomes the top word instead of the second word). CLICKING ON ANY WORD will cause a pop-up to that word so you may need to disable pop-ups to go out to Urban Dictionary from within the viz!
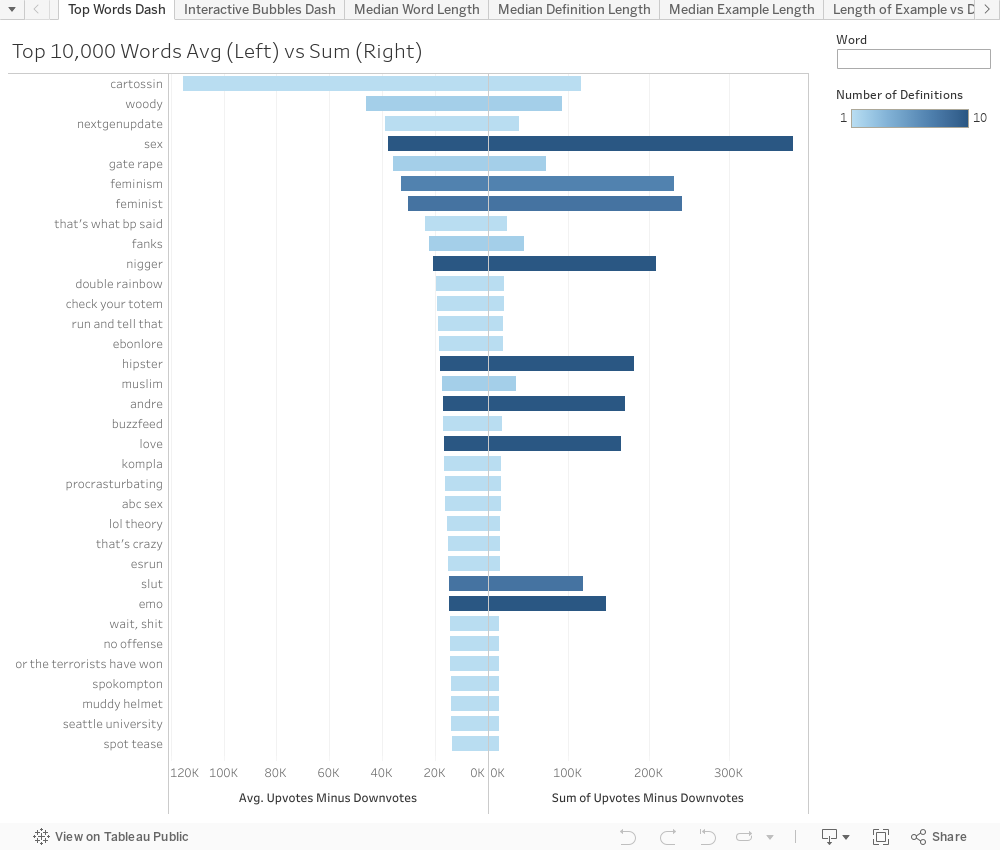


Now if we compare that to the trending words on Merriam-Webster you may see a SLIGHT difference.
How I picture the people at Merriam-Webster right now.

Now this next viz is really just to let you play around and reformat the data however you'd like. You can change both X/Y/Color axises to answer some of your own questions you may have. I'm still limiting this to the 10000 words... ALL words were just too many to really manipulate the data and click around to learn definitions!
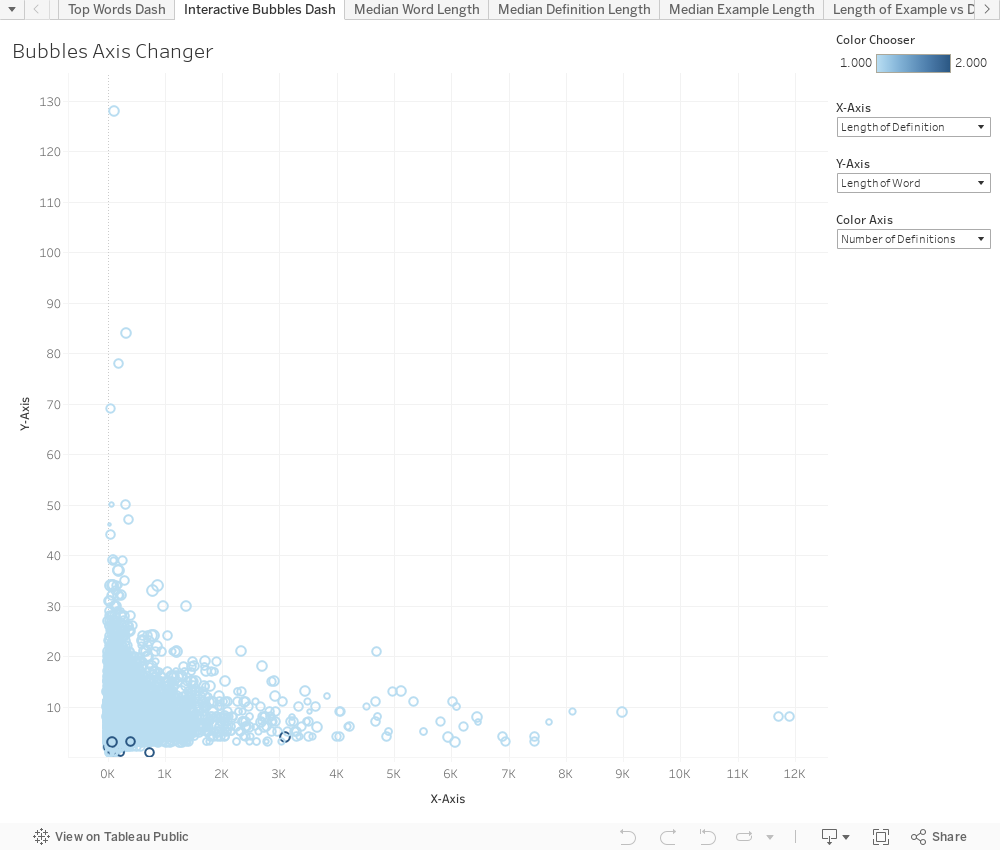


I was thinking because Urban Dictionary uses a "defid" field that seems pretty sequential so I wondered what some of the first words were. Obviously several had been deleted as out of the first 100 "defid" fields only 37 were left. The first remaining one that is visible is ID#7.... Janky which was posted December 09, 1999. The user Boomer is likely one of the first admins and has since posted 19 items total, most of which were at the very beginning of the site.

I hope every had as much fun kicking around in Urban Dictionary's data as I did! I know I learned some new swear words!

Who knew it was SO VERSATILE!
Of course if you have any questions or concerns please give me a shout in the comments below or via twitter @wjking0! As usual please share this if you found it fun/interesting!

How I felt after finishing this viz!

Thursday, January 8, 2015

G.I. Joe Figure Viz (because I had a weird dream)...


Do you ever have one of those dreams that feels SUPER real? I had one of those the other night. Ironically I was dreaming about hanging out with my old friend James and his wife and newborn when James was asking me about my new data collection methods. Then (in my dream) he surprisingly asked, "Oh my god can you index GI Joe figures too!?" "Umm... sure, I guess," I replied.

James (on his B-day) and his cute daughter! =)


I then woke up to find out James birthday was literally the next day. I poked around trying to find a nice GI Joe DB (because I figured if I dreamed about it I should probably do that!). I came across www.yojoe.com which has a really great database of Joe's located here: http://www.yojoe.com/action/

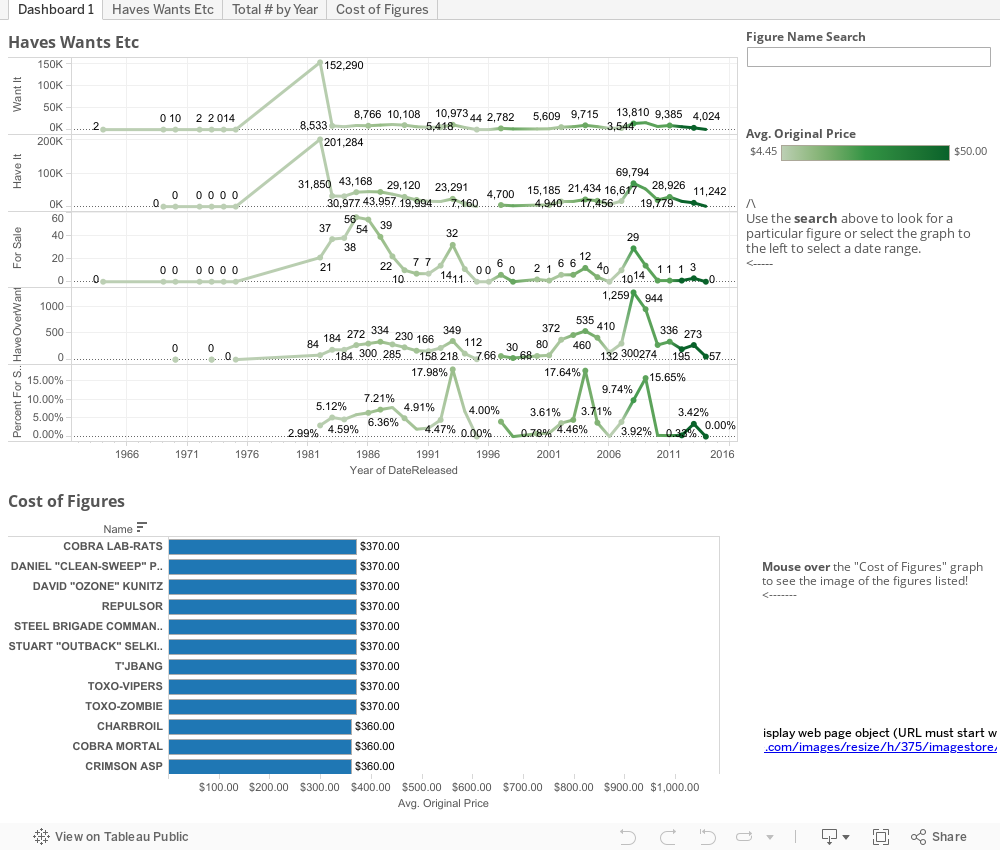
I did a quick scrape and got to work playing around, the most interesting thing to me is the "Haves/Wants/Sales"... NO ONE is selling their 1980's Joes... the 90's ones are WAY more fair game. =)  Anyway, because I had a dream and I hadn't published a viz in a while I wanted to just kick this one out while I put the polish on a few others I'm working on that will be more in depth. So here ya go, my birthday present for my friend who never really asked for it on his birthday because I had a dream (if that isn't all confusing enough!)!


As always if you have any comments/suggestions hit me up on twitter @wjking0.


Thursday, October 30, 2014

Roller Derby Flat Track Stats Data


WARNING: NOT MOBILE FRIENDLY Data Ahead!

As promised here's the data for ALL of Flat Track Stats info I've been working on. I've broken this up into a couple of Dashboards you can visit or you can go here to view the whole book as a collection.


Dashboard 1: The Whip It Effect

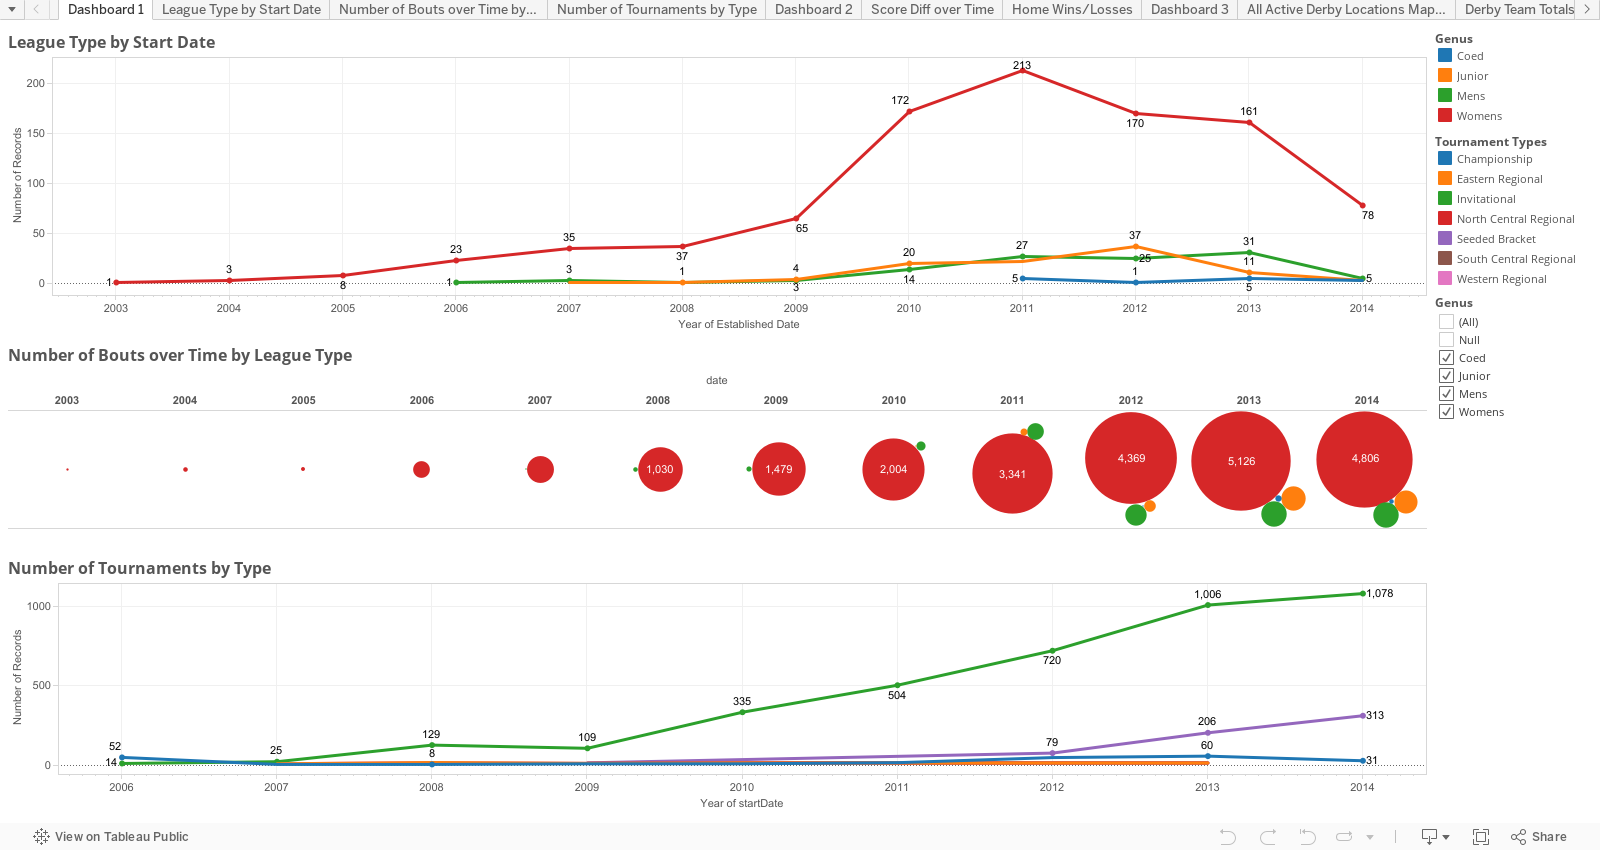
The first Dashboard shows League Type by Start Date (not filtering for leagues that no longer exist). Note the LARGE increase from 2009-2010. Whip It came out September 13, 2009 and was a large boon for the roller derby community obviously as numbers shot up FAR faster than in previous years or since.

The second part of the dash shows Bouts by Type over time and just shows exactly how many bouts and how exponentially it grew in the first few years of the sport to now having over 4500 bouts on average for the last 3 years! This is an area you can filter to see how many bouts there are comparitively between juniors, women, coed, and men's leagues by checking the boxes to the right.

Lastly you'll find the number of tournaments by type (most being labelled obviously as "Invitational") but it's interesting to see how many more Seeded Bracket tournaments have been held in the last few years.


Dashboard 2: Home Team Winners


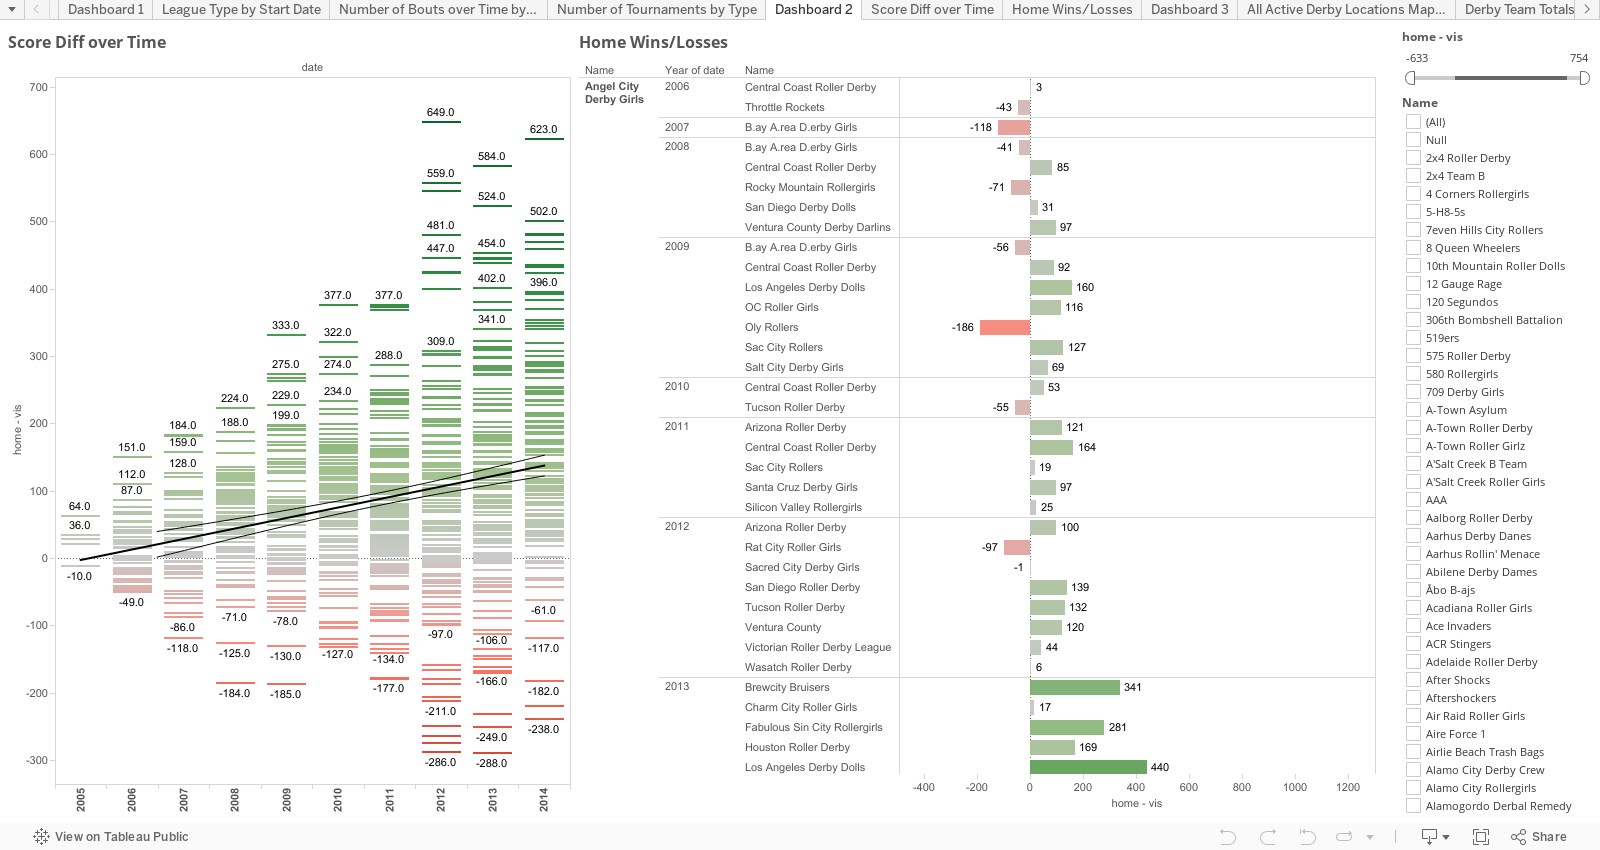
This dashboard I've filtered by default the teams that will be competing this weekend in the WFTDA Championships. You can click "All" on the Filter at the right, click it again to basically clear "All" and then type in your team name if you're interested how your team (or your league) is doing at home.

The left half of this dashboard are score differentials over time for all bouts (above the median line and in green means they won, below the median and going towards red means a loss). The trend lines show how those selected teams have done over time at home and if they're doing better or worse (hint: most teams are doing better and better with home field advantage even when normalized for total score, which this is not).

The right half of this dashboard is all the games that the selected teams have had at home. Again red is a loss, green is a win with the point difference at the end of the bar. This is just to kind of see how a team has performed over time and gives you a quick glance at who they've played and how they've done against them.


Dashboard 3: Where did all these derby people COME FROM!?


If you haven't watched the fancy video I made I'll go ahead and imbed that again here:


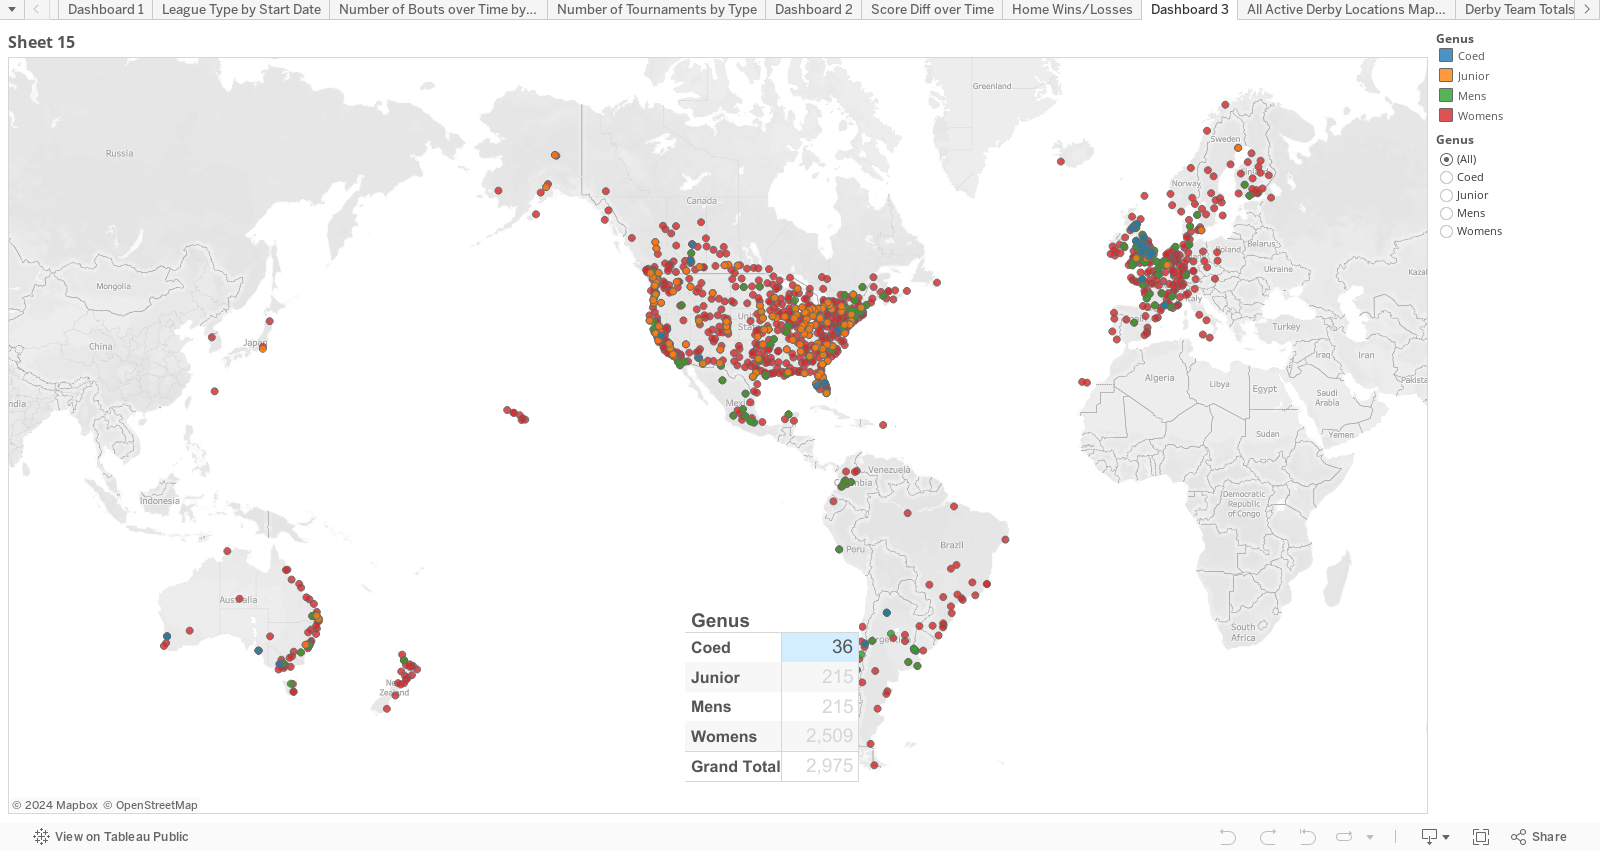
The data itself looks like Dashboard 3 where you'll see the totals for different types and can click around to sort by genus of league (again, coed, junior, men, women's and all).


Bonus Viz: How Popular is Roller Derby Where You Live?


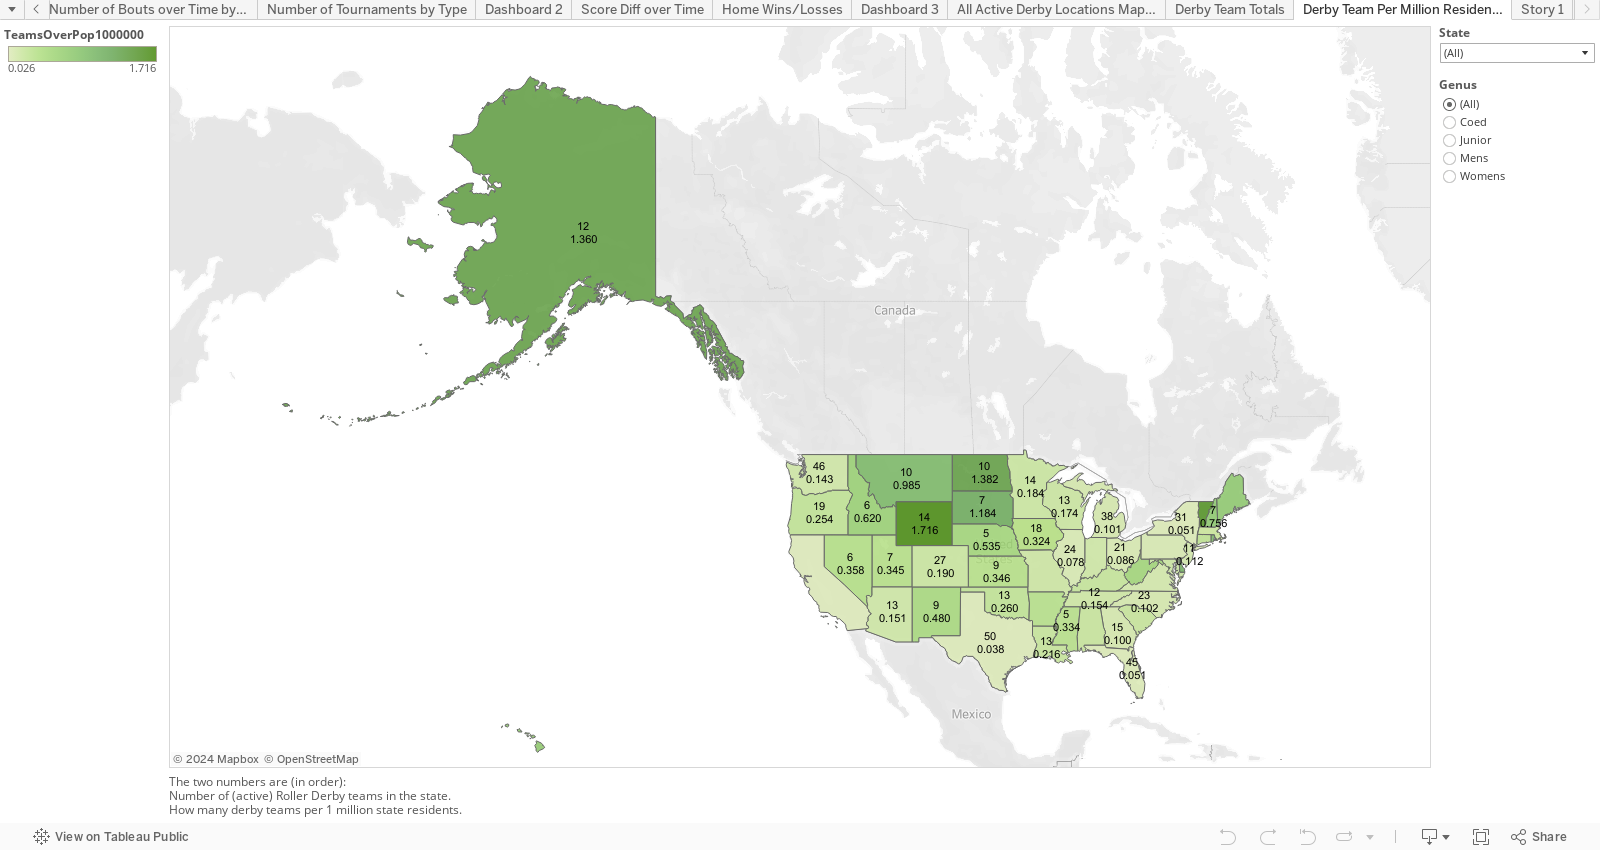
Finally I wanted to see, based on state population where derby was "most popular" by capita. I took 2013 State Population Estimates from http://www.data.gov/ and ran that against the states teams were located in. This data is based on all ACTIVE teams (teams with a "Disbanded Date != Null" were removed). Since I don't have the number of players per team I decided to multiply the numbers up a bit so we could see how many roller derby team per 1 Million people there were in each particular state. What I found was really interesting and will require more research but seems to point to the fact that larger states (regardless of population) tend to have more teams. The ultimate conclusion though is if you want to know where has the most derby per capita. Wyoming. No kidding gang!

The top number on each state is the number of teams (again only Active teams) that are in that state. The bottom number is the number of teams per 1 million people in that state's population. Play around, sort out just junior leagues or just look at your state in particular. All maps in these visualizations are zoomable so go nuts!


I hope you enjoyed these graphs and if you want to talk more about it hit me up via email here or at twitter @wjking0 to talk to me about more data nerd stuff I've been working on. Thanks again to Flat Track Stats for having an AWESOME data set to work with and I look forward to doing more in the future (penalty info anyone!?)! Much derby love! <3 -Jack Flash


Wednesday, October 29, 2014

Roller Derby Flat Track Stats (FTS) Data Preview Video!

Just to reitterate what I have down on my YouTube page this video was created using access to the FlatTrackStats.com data. It's a little sample of something I'll release probably tomorrow afternoon that will be FULL of all kinds of data for you roller derby kids to play around with! Because Tableau doesn't do animation well though I figured I would go ahead and export this to throw a little sample video of the data on YouTube for you to enjoy! The leagues that "pop in" during this video are the ones with listed start dates on them. Some leagues (for instance Derby City Roller Girls who are dear friends of mine) have no "start date" data but they (and everyone else with location data) is represented in the last still image you'll see in the video. Post it out and let me know what you all think and watch tomorrow for the BIG data drop! Much Derby Love! <3 -Jack Flash


Tuesday, September 23, 2014

WRFL 88.1 FM Lexington, KY MP3 File Breakdown

WARNING! Ultra-WIDE #DataViz Ahead!!!


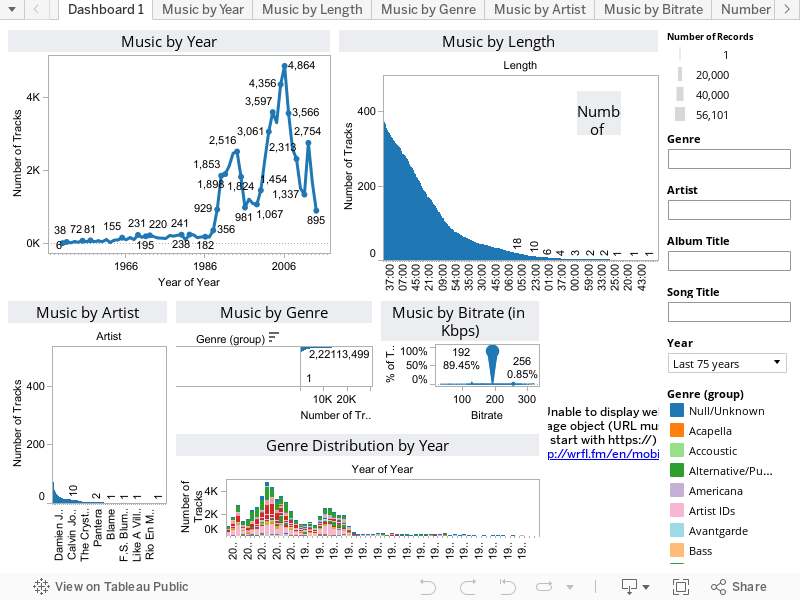
While I'm not making #DataViz out of #WeirdData I work as a Sys Admin for the University of Kentucky. One of the most neat and data-rich departments I get to support is our student-run radio station WRFL 88.1 FM. There are over 300,000 MP3 files stored on their server from their over 30,000 CDs and well over 30,000 vinyl records. At this point a good chunk of the CDs have been ripped and provides us with a rich dataset. It allows us to ask all sorts of neat questions of a unique set of data:


  • Want to know the average length of a Rock song? 3 minutes, 23 seconds
  • How many songs on the server have the word "Kentucky" in the title? 57
  • How many songs does Johnny Cash have on the server? 916

All that being said, I know that this data (because radio station employees can upload their own data to it) is not the most "clean" set of data. Do I believe there was a song from 1675 on the server? Probably not. Eventually also I'll clean up the "Genre" category a lot more over time. I expect I'll be updating this particular dataset somewhere in the 4-6 month range.

ALSO! I was going to throw in a logo and decided instead to throw a live-stream player built into the DataViz which refreshes when the track playing changes allowing people to search out that particular artist/album to see what else is there.


Let me know what you think and suggestions for how to improve the viz at @wjking0.


Wednesday, September 17, 2014

Kentucky Derby Winners Viz

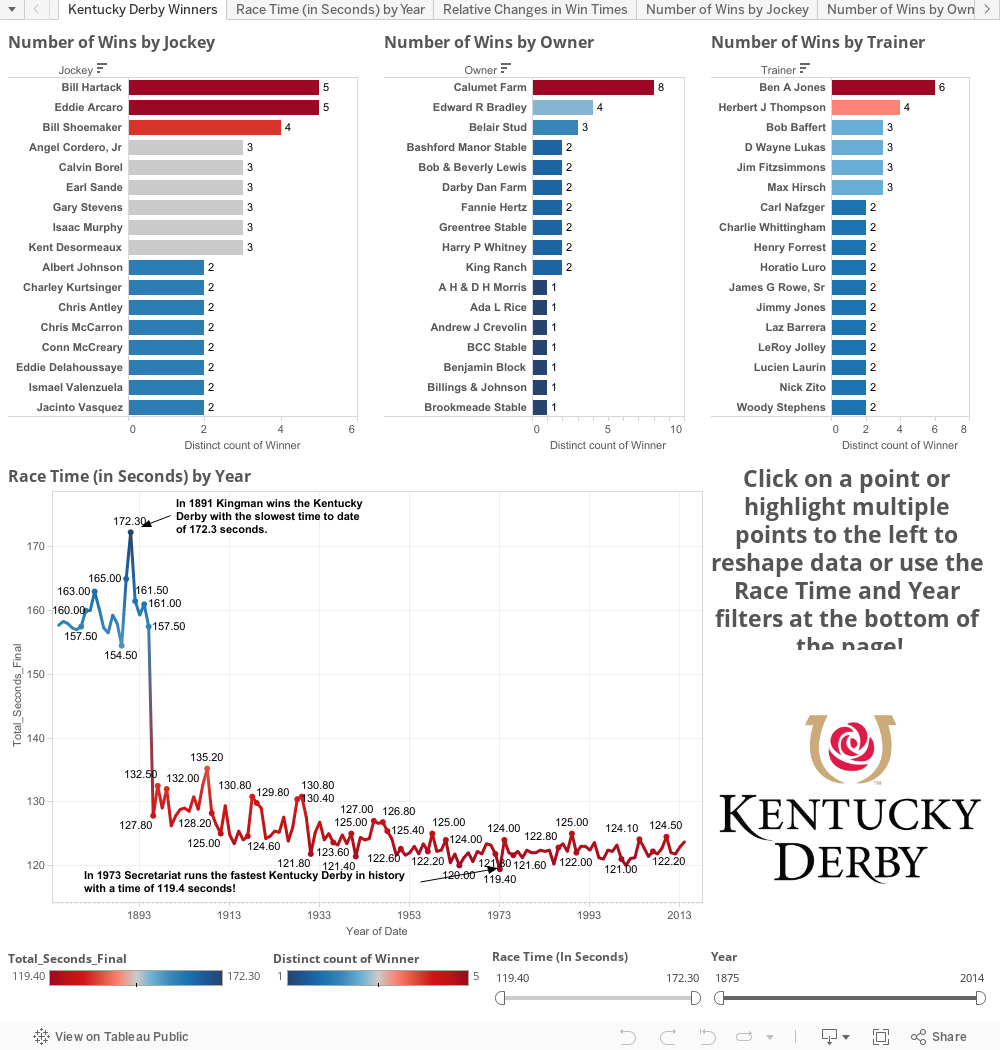
After attending #Data14 the Tableau Conference it came to my attention after a session from Jewel and Crew that I should start sharing out all my #WeirdData that I enjoy viz'ing? I hemmed and hawwed about what kind of viz to do so I figured I would start with one from Kentucky (my current home). Here in Kentucky we love three things above all else... Basketball, Bourbon, and Horse Racing.

The Kentucky Derby is one of the oldest continually running horse races in the world. The data set there is pretty expansive but I was amazed at how hard it was to find. The data I ended up using I scraped from a couple Wiki's and I have some other data that I may enhance this with later (such as Purse collected). For now though enjoy playing with my first ever blog post and my first ever Tableau Public Viz. Comments/suggestions welcome! @wjking0