Showing posts with label #TableauPublic. Show all posts

Saturday, November 20, 2021

Tracking Bigfoot with Data - BFRO Data 1950-2021


Hi everyone... I know it's been a while since I posted. If you could only see my backlog of draft vizzes you'd know how many things I meant to be posting! I've had this one queued up fairly recently and I realized this weekend is Cryptidcon in Lexington KY so what better time to viz one of the most recognizable ones! I scraped data from BFRO.net and let me tell you... the only thing messier than bigfoot's hair is trying to clean data without understanding the shifting structure of their site over the years! That said I appreciate the length of time they've gathered data and the depth of text!
Me dusting off this blog

I've recently been spending a good deal of time in Washington State, particularly Northern Washington where Bigfoot/Sasquatch is on EVERYTHING. I asked my partner and she said that there are tons of sightings in that region of WA so I figured I'd see if she was right. Full disclosure, as WA is her home and she has a Bigfoot hoodie she's a little biased! 

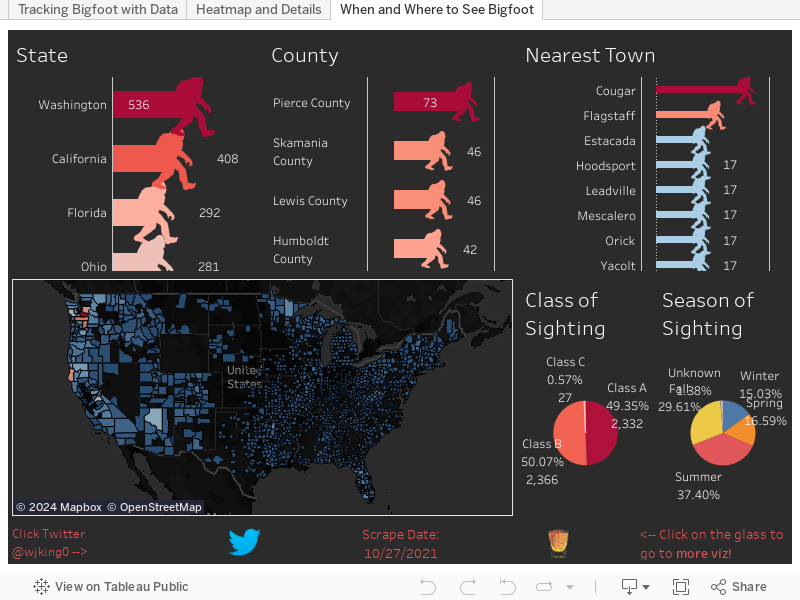
So below you can see my partner was COMPLETELY right... Below you'll find numbers by State, County, and Nearest Town (which can be linked to multiple counties etc). Then of course a map and pie charts representing class of sighting ("A" being the most 'real' sightings, to "C" which can be 'heard a noise') and then the seasons of sightings so you can figure out where you need to go if you want to stay warm and hunt Bigfoot sightings (hint, southern US).
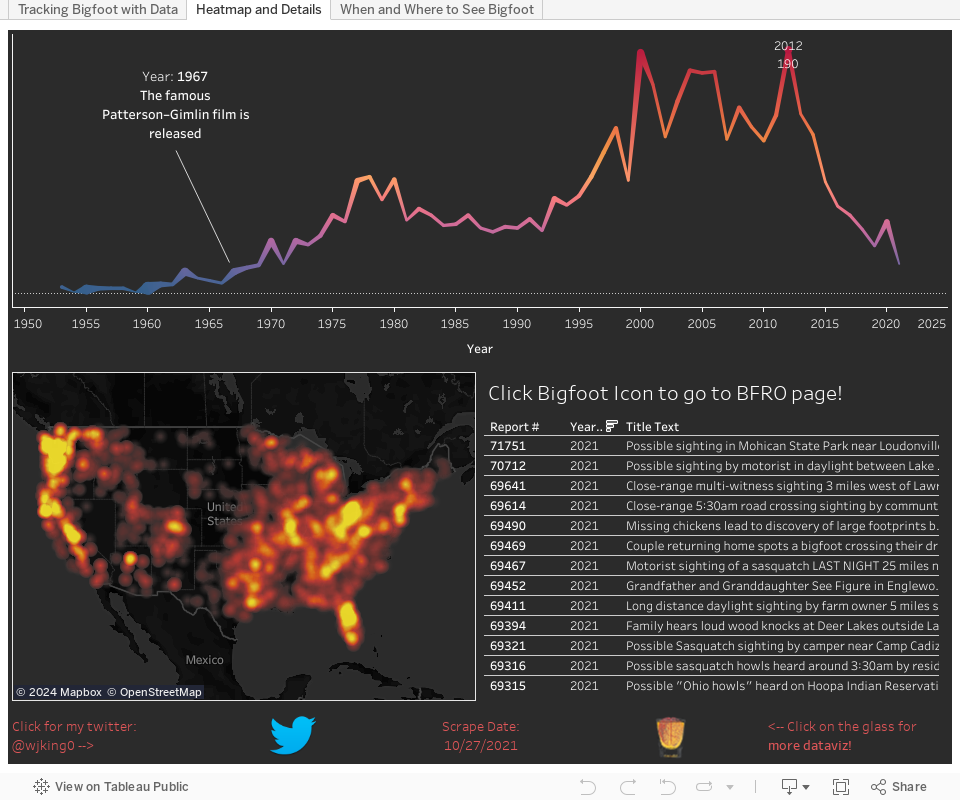
Also since we're talking about Bigfoot... Remember Harry and The Hendersons?! John Lithgow was in that! Interestingly enough, even though popular culture references to cryptids tend to increase reports of sightings Harry and The Henderstons did not. The 1980's as a decade had the largest overall lull in Bigfoot sightings (which you can look at in the viz below) but they picked back up in the early 1990's for a reason I'll go into on a future blog post.

Pretty sure this movie gave me nightmares

Now let's look at some more data below. I wanted to do more of a heatmap look at the US and when you zoom out one of the things that is crazy is Florida really does become an obvious place to look for our large-footed friend! Also if you're looking for details of particular events the below dashboard will let you select points in time or highlight map areas (also remember to use the map search at the top left of the map itself) to filter the details to just the values you're interested in reading or clicking through to read more detail on the actual site.
Florida in 2012 was clearly like
a little shining dong on America

Also given one of my best friends just moved to the sunshine state I figured I should warn him that perhaps it's the proximity to sasquatches make people a little nutty, the 2012 spike in sightings (the largest currently on record) can largely be attributed to the sunshine state. It appears even cryptids need to retire! As always if you have any questions or concerns hit me up on twitter @wjking0
Bugs had the right solution to the Bigfoot problem in FL


Wednesday, May 15, 2019

The Most Popular Cartoons of All Time


I frequently grab a delicious breakfast at one of Lexington's many bakeries and about a month or so ago I was at Magee's Bakery. On Saturday mornings (my "pastry day") they play old school Saturday morning cartoons like Mask, GI Joe, etc. I got thinking about cartoons and how today's compare with the ones I watched growing up... and how some long running shows (like The Simpsons) fare over time.

I did some cursory searches and found IMDB had a list of shows (Top 250 Animated Series by Avg Rating). I thought that was neat but I wanted to look at the shows over time so I designed a scrape to extract every episode ratings data from each episode from each season. These had things like number of people to rate, original air date, etc.

I then started vizzing to get my answers!

Things to Note:
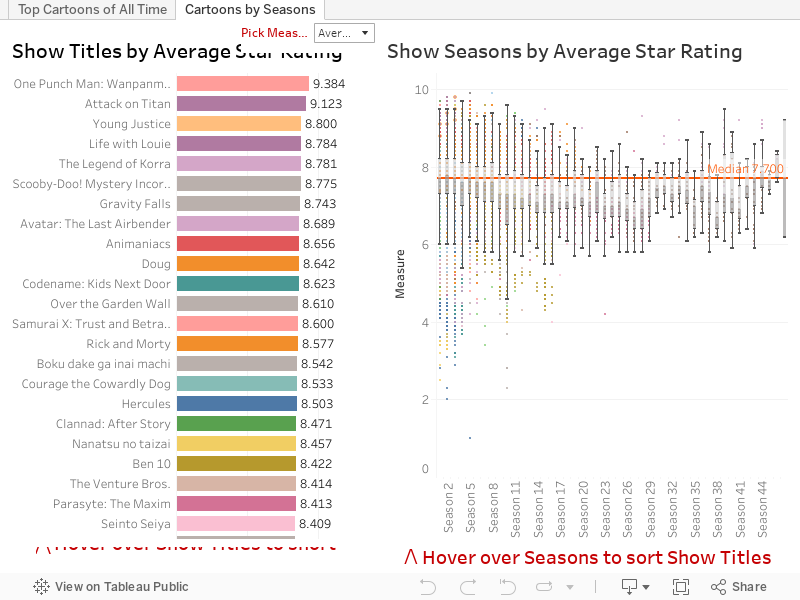
  • Most shows don't go past 4 seasons (by season 5 up to 73% have been cancelled)
  • 1/3 of cartoon series don't make it past the first season
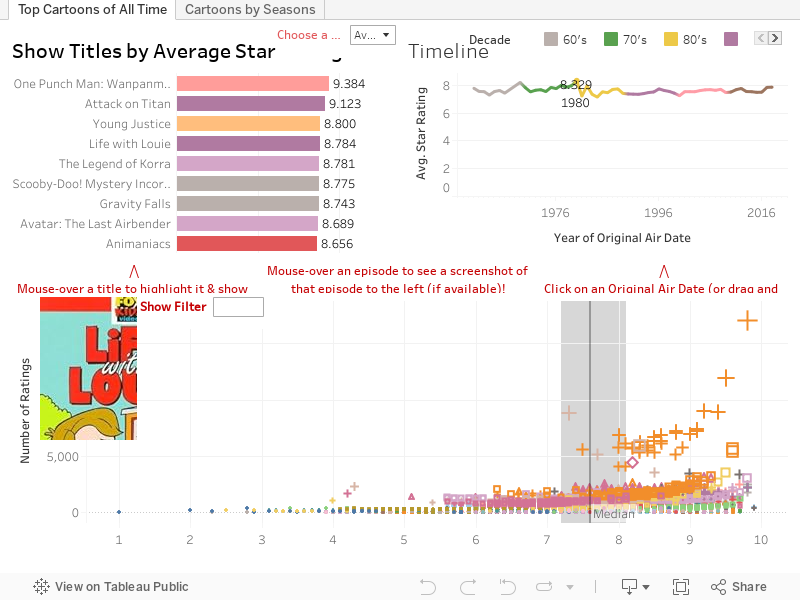
  • Median Star Rating for an episode is 7.6
  • Rick and Morty have an ENORMOUSLY passionate fan-base (6,742 votes per episode average) with a votes-per-episode level that is 4X the next highest show (The Simpsons at 1,636 avg ratings per episode)
  • Star ratings (overall) decline by season without any real upswing until a show hits it's 15th season (which only a very few percent do)

Here's a quick viz of top cartoons by season and their season breakdown. Mouse over the show to get a breakdown of their seasons ratings in a little box-plot to the right.


But what if you REALLY want know the "BEST" rated cartoon episode ever...? The problem becomes one of rose colored glasses. I'm personally a fan of Batman The Animated Series... sadly of ALL the Batman cartoons Batman TAS ranks the LOWEST!


I then started thinking about what decade had the greatest cartoons ever and so I built the next viz to help me encompass everything a little more completely (1980 has the highest rating year of any year BTW)... If you click on a year the graphs will reform follow the DIRECTIONS IN RED for help navigating the entire history of cartoons and use your won criteria to figure out for yourself what is the Best Cartoon of All Time! 


What do you think? One Punch Man? South Park? The Simpsons?


As always hit me up on Twitter @wjking0 with any questions!

Thursday, August 9, 2018

Creepypasta - The Popularity of SCP Stories


I had originally planned to do this visualization during the month of October as I felt it would be a little more fitting at that point. However due to the overwhelming votes for this viz over the other one I had planned to do at this time led us to Creepypasta winning out! I decided to scrape the SCP Wiki as I felt it was one of the best curated sources of Creepypasta around.

Unfortunately Tableau Public no longer lets you embed http data sources (rather than https) and SCP is purely http only. =( As you can see below it looks SOOOOO nice in Tableau Desktop!


Why will you let this work in Desktop but not Public Tableau!!?!?!


Some things to note:
Below is the breakdown of time/date/days of posts of SCP articles:


Here is the breakdown of the "popularity" of SCP CreepyPasta, you can arrange it just about any way you'd like coloring or sizing it by different aspects or choosing a date range and the scatter plot above will reshape in that way. For the shape metrics I decided to go with object class (which took QUITE a bit of cleaning) or if an object was marked as "Safe".

Click on individual entries to be taken to the page about that particular SCP!


As always hit me on twitter @wjking0 or leave a comment below or on other social media for comments/questions.

P.S. Sorry this one took so long and was kinda lackluster, I was hoping to find a work-around for displaying webpages inline with Tableau Public but sadly couldn't quite make it happen. =/

Thursday, February 22, 2018

University of Kentucky Crimes Mapped


Sorry it's been a while since I posted! I promise I'm going to get on a better public-release schedule.

That said... this data, while formatted nice has a TON of fat-finger errors in it... it's hand-entry of over 16,000+ things from a state-wide police system to their front-end web interface. If you'd like to hear about it and all the minutia that lead up to this and why it's important to me click here.

Me scrubbing data only to find more data that needs scrubbed.
With recent news of the mishandling of a poor young woman's case as detailed by the Kentucky Kernel I decided now was a good time to talk about the public nature of crime data... Let's get into it!


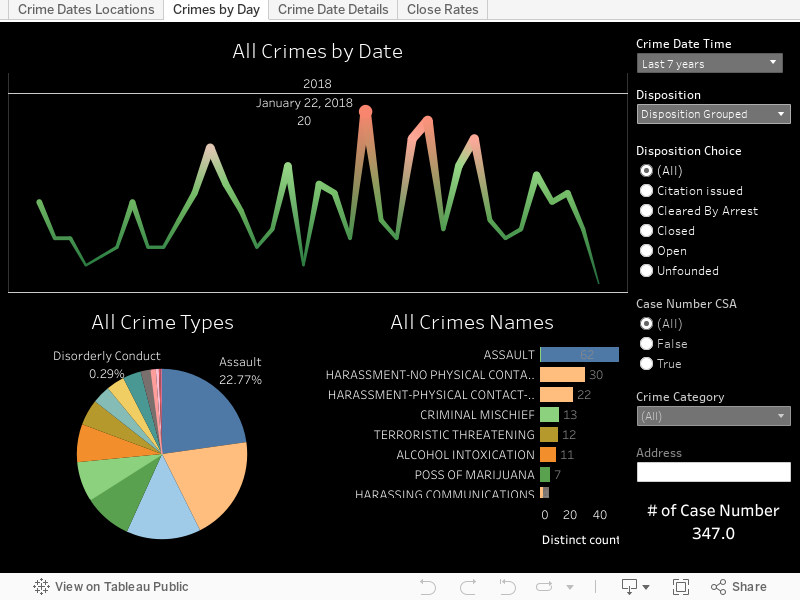
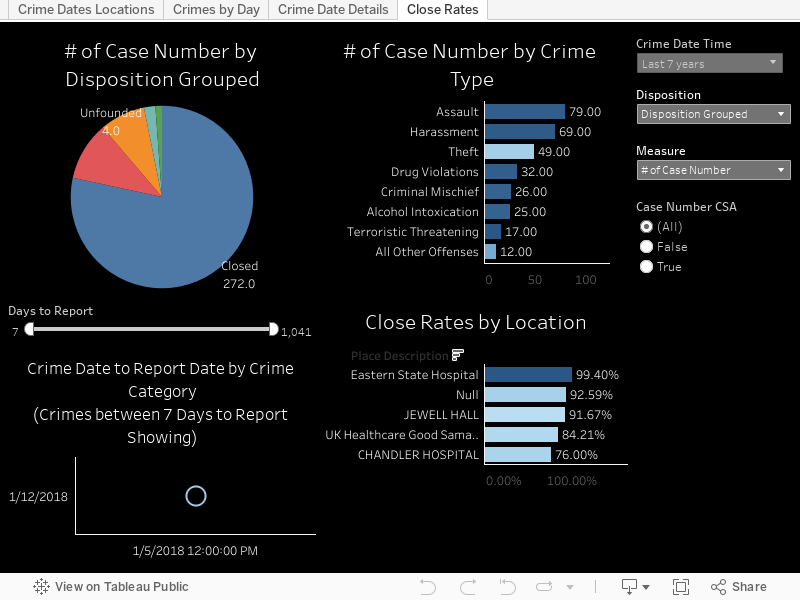
A couple things to note about the above viz is that CSA cases do NOT require a police officer to be involved. Those stand for "Campus Security Authority" so a CSA case can be something like someone spitting on a nurse (a frequent occurrence unfortunately) or drinking in a dorm room etc. To get an idea of the "real" police workload change the filter for "Case Number CSA" to False. Now you'll be looking at only the crimes where an actual officer was involved.
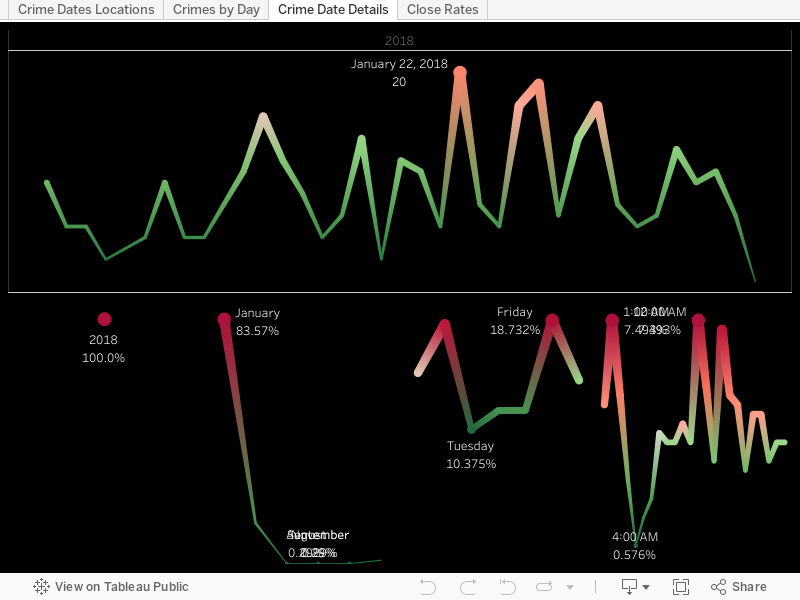
Aside from Eastern State Hospital (which is largely a mental health facility) what is one of the main drivers of crime on campus? Well... turns out that's UK Football. When you look at crimes by individual dates over the years there are some pretty obvious spikes. When I checked the dates, yep... all home UK football games.


What's that? You want to know the longest list of charges? Well that would belong to case 20143565 which has the following laundry-list of offenses:
"FAILURE TO ILLUMINATE HEAD LAMPS/V, DISREGARDING TRAFFIC CONT DEV-TRAFFIC LIGHT/V, OPER MTR VEHICLE U/INFLU ALC/DRUGS/ETC. .08(AGG CIRCUM) 1ST OFF/M, FLEEING OR EVADING POLICE, 1ST DEGREE (MOTOR VEHICLE)/F, FLEEING OR EVADING POLICE, 1ST DEGREE (ON FOOT)/F, CARRYING A CONCEALED WEAPON/M, WANTON ENDANGERMENT-1ST DEGREE-POLICE OFFICER/F, POSS OF MARIJUANA/M, TRAFFICKING IN SYNTHETIC CANNABINOID AGONISTS OR PIPERAZINES/M, POSS CONT SUB 1ST DEG 1ST OFF (COCAINE)/F, PROMOTING CONTRABAND-1ST DEGREE/F, WANTON ENDANGERMENT-1ST DEGREE/F, POSS OF OPEN ALC BEVERAL CONT IN MOTOR VEH PROHIBITED/V."


Want to dig a little deeper into specific crimes? Check out the viz below!


Realistically though the University of Kentucky Police are really SUPER AWESOME and nice people whom I've met with personally several times. The next chart highlights close rates of cases and the ones you'd expect to not get closed (theft, burglary, etc) are the types of things you see most unsolved. Click around and see what you're curious about. When I was going through the data one of the most concerning things to me was to look at the "Unfounded" category and see how Sex Offenses is the highest rank (when including CSA cases). That doesn't seem like a thing people would exaggerate on and I trust the UK Police to have done their due diligence, but I also am concerned about the culture we live in and how that affects things like this in aggregate.


I'd also like to share this cleaned version of data that I am posting out on Google Drive for download as well as one of my new fave repositories at Data.World. If you'd like to know more about what went into cleaning the data again go to the page here where I talk about some of the data cleansing that went on.

As always I hope you all found this informative and if you have questions please post a comment below or hit me up on twitter @wjking0!


Wednesday, April 12, 2017

30+ Years of Video Game Music


This is part of my #1YearOfViz series! Check out the archive here: http://bourbonandbrains.blogspot.com/p/one-year-of-dataviz.html
One of the first things I wanted to mention was that I had (what I felt) was a really excellent interview the other day with Delta Private Jets. It felt much more in my wheelhouse than when I did the interview a couple of weeks ago with VetData. In all honesty I think they were looking for more of a programmer and not an analyst (and I heard they hired an ex programmer for the position actually). Anyway... I kinda felt like I might not fit in with the Delta 'corporate people' having worked in Academia my entire career but the people were pretty rad and the job sounds exactly like the type of cross departmental data-exploration that I love diving head-first into! Plus... I mean... things like flight benefits would be pretty rad...
How I felt going to interview with Delta Private Jets
Due to that (interview business) and my girlfriend's kids being on Spring Break I'm publishing last week's viz today and I'll publish another one later this week also!

It's time to get down!
Now into the real subject of today's post! Video Game Music! I started this little endeavor after listening for a couple of years now to the Legacy Music Hour Podcast. I can't recommend it highly enough if you're into that sort of thing... and if you're not, what are you reading this post for!?

I poked around at several music databases to find the site with some of the most comprehensive datasets. I ended up landing on VGMDb.net, their site format and abundance of already available stats allowed me to really cross-check what I was getting from them!

The dataset seemed easy enough to get scraped. I'd liked to have gotten the track data and lengths as well but the formatting below the initial listing got a little too funky to reliably pull with Octoparse. Still initial costs and years of release are pretty awesome so let's work with those... Except there was a minor (read: HUGE) problem with the cost data... It was in about two dozen different currencies (some of which were no longer in existence)!

I ended up parsing the type away from the number and did the conversion manually according to today's dollar values based on this site's conversion. I thought about it after I'd already written the following formula and realized that I could have done a quick scrape and join instead for the conversion values. Again due to the complexity of the whole conversion process I didn't do past value converted to current values with adjustments for inflation etc... I just felt it was a bit too much hacking for a few cents to a dollar difference on some things.

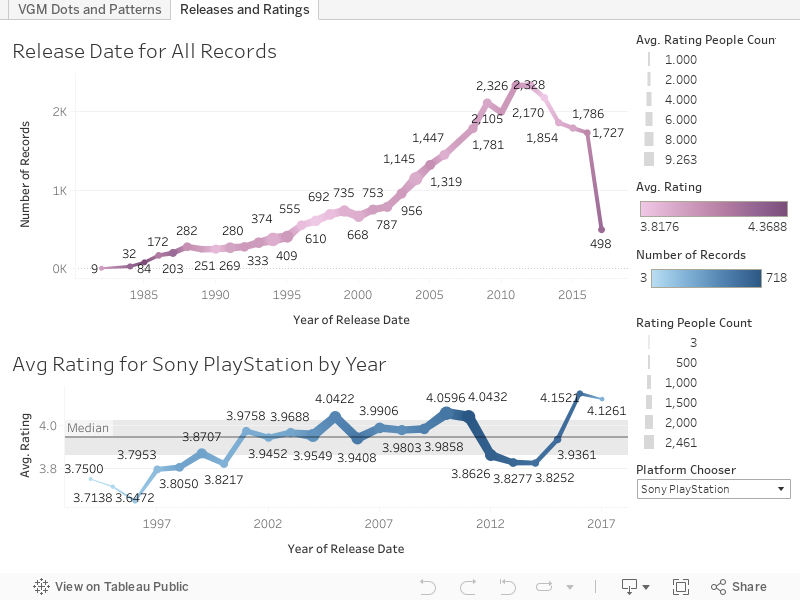
Let's get into the data! This first dash is a generic look at the full release of game soundtracks (on the top) followed by a look that is customizable by Console Type at the bottom to look at how ratings for the soundtracks of games for that particular system changed over time.


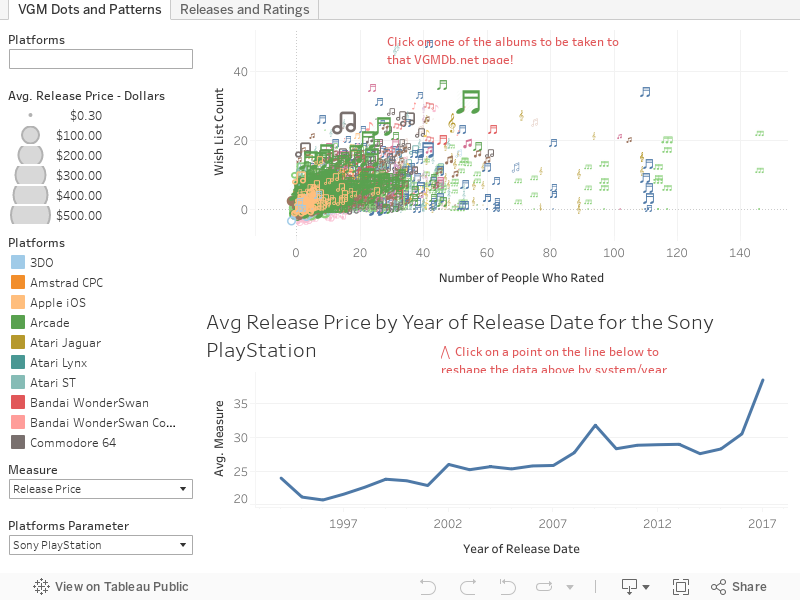
This last one is one where you can explore some of the extremes of the data. The bottom half of this dash reshapes the top ("dots") half of the viz. You can choose what types of measure you'd like to use by year and click on the specific year-point on the line to reshape the "dots" at the top. You can then click on the dots to be taken to that specific VGMDb.net page about that album! I think it's a fun kind-of tiered way to get at both analysis and deep dives into the data through some segmentation!


As always if you have any questions hit me up on twitter @wjking0! This whole viz had made me feel SUPER nostalgic... time to go play some old games!


Thursday, March 23, 2017

Reddit /r/Datasets Analysis


This is part of my #1YearOfViz series! Check out the archive here: http://bourbonandbrains.blogspot.com/p/one-year-of-dataviz.html
Let me start off by apologizing. I've been trying to work out some issues with +Tableau Software and getting Tableau Public working with the last several web pages I've tried to do a web-part embed with... and I've tried all the suggestions on the support forum. It works fine in Tableau Desktop and Tableau Public apps but once I upload it to Tableau Public it just doesn't show up. I originally thought it was the mix of http (this blog) and https (Tableau Public) but even when viewing just on the main Tableau Public page it is still showing up as a blank page. =/


Me shaking the 'Do Better' stick at Tableau Public


What this means for you is today's viz (in part) features new window pop-ups because the integration isn't working right with the Tableau web part.

Today's dataset is an analysis of all the links I could mine back through the history of a subreddit I am one of the admins of. If you're reading this blog and you're into dataviz and you haven't been to /r/Datasets yet then you really need to!

How being a subreddit mod really feels.


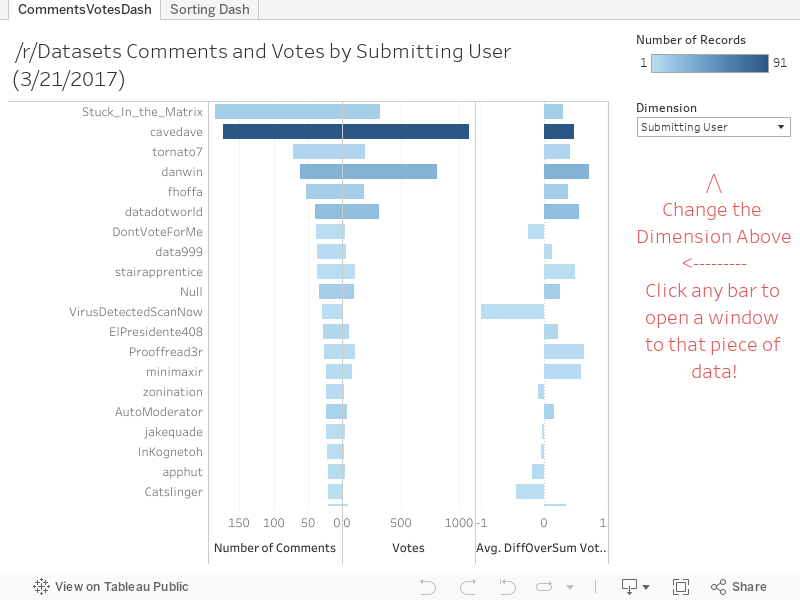
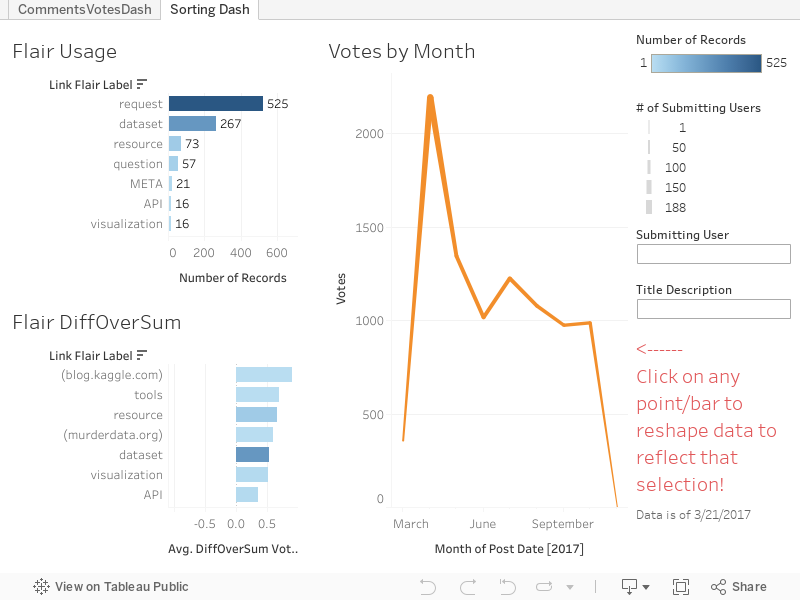
Below is the viz... you can change which dimensions you'd like to measure votes/comments by and if it has an associated link (such as profiles, domains, etc) you can click on the bar and a pop-up will come up with that data loaded in it.


The second part of this viz is just a little more in-depth breakdown of things if users from the subreddit are checking it out and want to see a how different categories are broken down.

Ultimately here are some of the base numbers:


52.55% are "Requests"
26.3% are "datasets"
7.31% are "resources"
5.71% are "questions"


Keep in mind this data only represents the past 1000 or so posts in /r/Datasets only really spanning about 3 months worth of time from the date of 3/21/2017 (the original scrape date). In the future I'll likely work on a more "live" version of this probably utilizing some IFTTT recipies but until then I hope you enjoyed this little glimpse into the weird world of datasets and the people who love them! <3


As always if you have any questions/comments/concerns hit me up on Twitter @wjking0 or in the comments below!

A meta image about a meta reddit dataset from where... ? You guessed it... reddit.


Friday, March 17, 2017

Urban Dictionary - Top Words (NSFW Text!)


This is part of my #1YearOfViz series! Check out the archive here: http://bourbonandbrains.blogspot.com/p/one-year-of-dataviz.html

WARNING! If you're offended by "bad" language steer clear of this viz!


Originally this week I was going to work on a viz about Girl Scout Cookies.... I was hoping to find some sales numbers... then after some brief searches I realized that was a pretty fruitless endeavor and the closest I could come was looking at the google trends for the different Girl Scout Cookie names. While interesting... isn't exactly dataviz worthy.


So switching out from the totally mundane and safe for work topic of Girl Scout Cookies (THIN MINTS FOREVER!)... I flipped my mindset entirely and decided to look at Urban Dictionary. I was thinking back to an article that I read about when IBM's Watson was fed Urban Dictionary to help learn slang and ended up having to have it purged as the AI wouldn't stop swearing as part of it's normal speech pattern.

I considered attempting to scrape it but wasn't sure how large a scrape that would be... when low and behold I found someone had already done the work for me! Huzzah!
I'm too lazy to scrape that much data!
I've compiled some quick facts I've learned about words... which is a hilarious sentence to write. I'll link to sources when there was one otherwise it was something I learned through the analysis of the data:
  • Merriam-Webster 

  • Urban Dictionary 
    • Avg 1.277 definitions per word
    • Avg word length 10.05 letters
    • Median word length 9 letters
    • Total number of definitions is 2,079,261
      • This contains phrases as well as words
    • 1,457,980 Unique Words/Phrases

Before we actually get into the data remember that I just manipulated the data into the viz and am not the author of any of this. If you're easily offended by slurs or bad words... now would be the time to check out another viz!

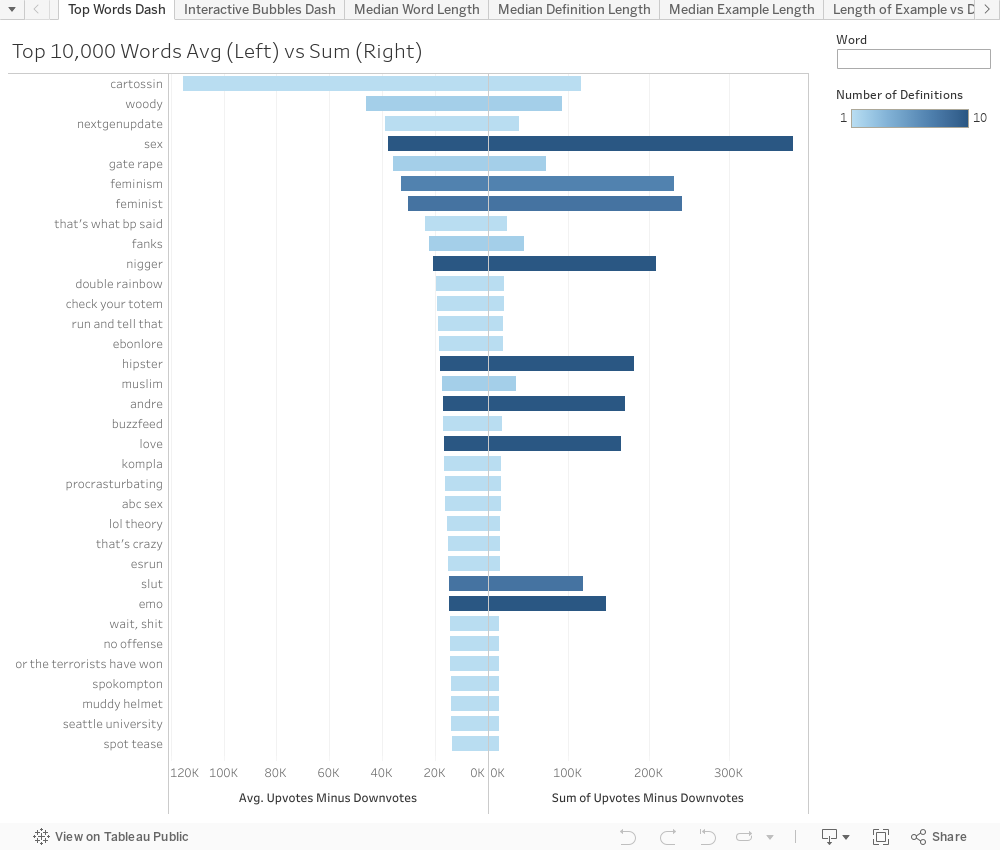
I limited the whole viz to the top 10,000 words/phrases by their sum difference between their Upvotes and Downvotes. Some had multiple definitions and so the list looks slightly different if we use Total instead of Average for the Up/Down difference (in that instance "Sex" becomes the top word instead of the second word). CLICKING ON ANY WORD will cause a pop-up to that word so you may need to disable pop-ups to go out to Urban Dictionary from within the viz!


Now if we compare that to the trending words on Merriam-Webster you may see a SLIGHT difference.

How I picture the people at Merriam-Webster right now.

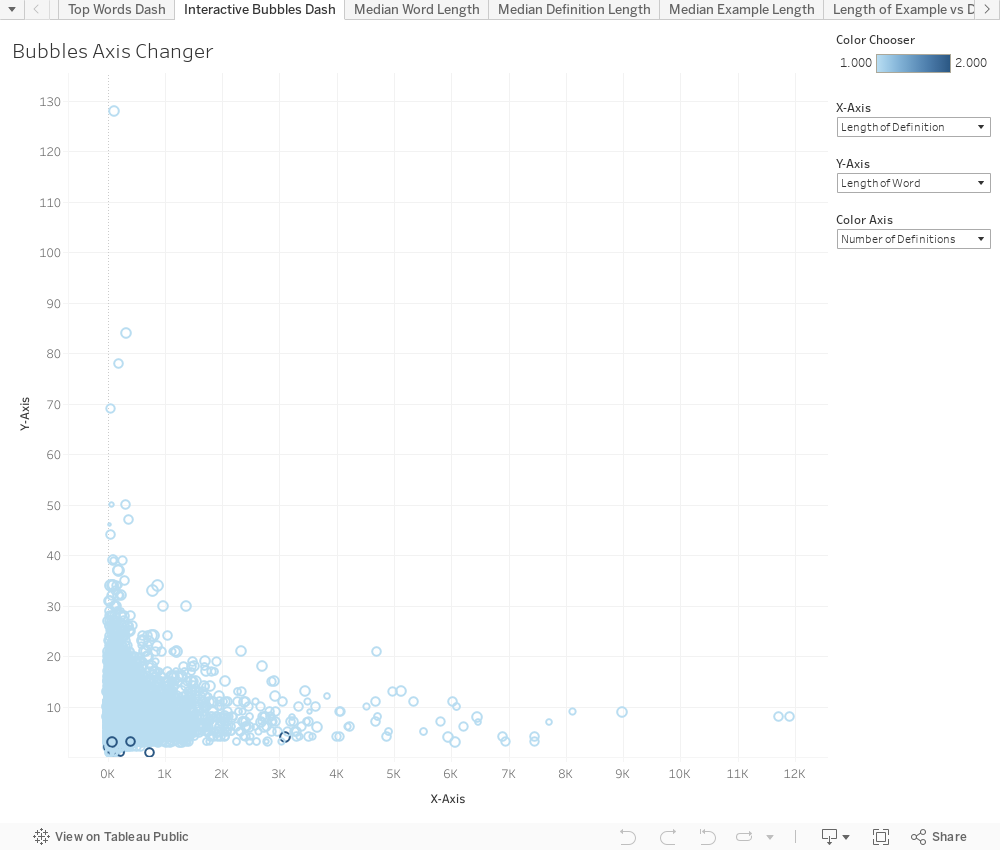
Now this next viz is really just to let you play around and reformat the data however you'd like. You can change both X/Y/Color axises to answer some of your own questions you may have. I'm still limiting this to the 10000 words... ALL words were just too many to really manipulate the data and click around to learn definitions!


I was thinking because Urban Dictionary uses a "defid" field that seems pretty sequential so I wondered what some of the first words were. Obviously several had been deleted as out of the first 100 "defid" fields only 37 were left. The first remaining one that is visible is ID#7.... Janky which was posted December 09, 1999. The user Boomer is likely one of the first admins and has since posted 19 items total, most of which were at the very beginning of the site.

I hope every had as much fun kicking around in Urban Dictionary's data as I did! I know I learned some new swear words!

Who knew it was SO VERSATILE!
Of course if you have any questions or concerns please give me a shout in the comments below or via twitter @wjking0! As usual please share this if you found it fun/interesting!
How I felt after finishing this viz!

Monday, February 27, 2017

DashWrecks - The Best of CakeWrecks

This is part of my #1YearOfViz series! Check out the archive here: http://bourbonandbrains.blogspot.com/p/one-year-of-dataviz.html
I've been looking for a fun dataset to work with lately. While sitting around the other night my girlfriend and one of her kids was sitting around going through CakeWrecks.com and wailing with laughter.

How I hope people react to this less serious post!
They wondered out loud "I wonder which are the most 'popular' cakes...?" And I thought to myself... "You know who could find out.... !? I could!" So I went to work scraping all the posts made up until that point looking at metrics such as Facebook Shares, Pinterest Shares, Other Shares (I'm assuming twitter), and number of comments left on each post. I ignored "email" shares as the numbers were just really too low to make a difference in most cases (think single digits).


Before we get into the data I wanted to say that while this is only one Dashboard I put a lot of TLC into it... EVERYTHING is selectable/changeable ... you can change the measurements on the X and Y axis (labelled up/down and left/right for those non-math inclined people) to use any of the available measurements... and you can change the coloration to either be by 'Year' of publishing or by the Name of the person publishing. I included median lines so you can get an idea of approximately what the medians are for different types of measures... like for Facebook it's pretty high but Pinterest tends to be pretty low (comparatively speaking). One thing I noticed while I was playing around was that Pinterest interest (try saying that 5 times fast!) tends to be highest on 'Pretty' cake posts where as Facebook tends to love the Wrecks more!

Additionally you'll notice all the dots are all cake themed! I tried to pick appropriate dots for each user based on their frequency of posting... so yay custom icons in the viz! If you click on one of those cake-themed dots the left side of the screen will load up that particular post so you can browse each and every wreck! Anyway... click around and play with the data below!


I have to admit that one of the most widely cross-posted cake posts is also one of my favorite titles... "You want vagina cakes? I'LL GIVE YOU VAGINA CAKES." I literally though I was going to pee myself laughing at the title alone! Do yourself a favor and see if you can figure out which one that is to view that gem yourself! You know what the absolutely hardest part of doing this entire viz has been? Figuring out which of the MANY hilarious animated cake gifs to use!

Me trying to pick the right gifs to use for this post.


If you have any questions as always please hit me up on Twitter @wjking0 or in the comments below