Monday, February 22, 2016

Analysis of Roller Derby Gender and Relationship Study 2015 (Preliminary)


This post has been a LONG time coming...

If you need to catch up on the history of this study you can find it here: http://bourbonandbrains.blogspot.com/2015/02/roller-derby-relationship-and-gender.html

Let's jump right into the results!

One of the big questions I wanted to answer was whether or not roller derby increases likelihood of divorce or infidelity? The other question is seemingly a lot more ridiculous but remains a roller derby myth up until this day; Does roller derby "turn people gay"? (I HATE that misconception). I'm a data guy so I needed numbers to back up my claims.  Thusly, the survey went out in its last iteration.

Let's answer those questions, but first let's look at our demographics.
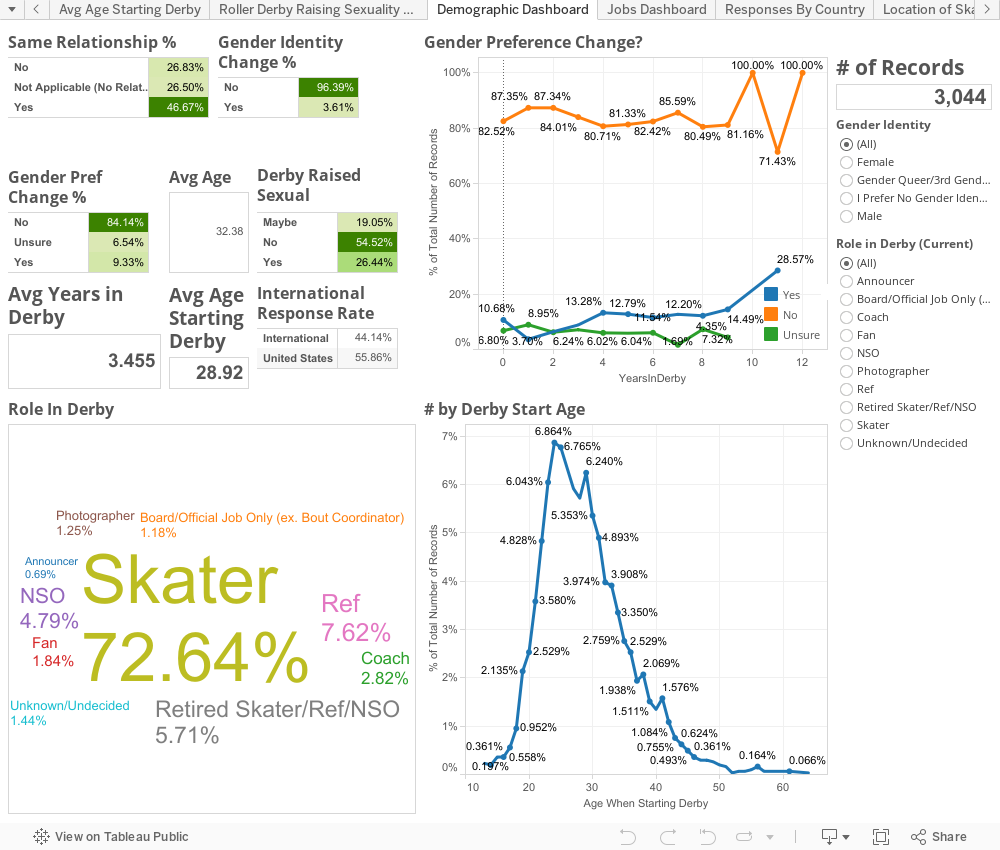


Now if we look at divorce rates for skaters we find that based on age brackets roller derby divorce rates are almost precisely the same as the national averages for the United States of America (where approximately 50% of all respondents reside). It appears that age, more than roller derby involvement, is the factor in the divorce rate of derby skaters.


Further proof of marriage being fairly stable when it comes to derby is this chart showing that of those who come into roller derby married almost 80% are still married, you can adjust the Starting vs Current Status to see the "Flow" of where skaters go relationship wise.



Subsequently, if you want to look at the "Categories" of who people date in derby you'll see slightly lower numbers in this survey as far as people pre-derby with a non-derby affiliation compared to the married graph listed previously. This would mean that it's very likely that some of these significant others have subsequently become involved in roller derby due to their spouses' involvement. Play around with that graph and compare to the above one below!



The next big question is if derby influences sexual preference?

While there is a slight increase over time in interest in expanded sexual horizons past heteronormative relationships this can, I believe, be accounted for with the fact that there is a VERY high percentage of LGBT athletes participating in the sport. To put it in numbers, compared to estimates for United States populations just a few years ago it's 10-12x what we would find reported as a national average. I think it's this exposure to a high rate of LGBT experiences which might account for some of the results that were seen.

Unfortunately I cannot find (currently) any studies that look at the rise of LGBT self-identification over time to compare to this study. Therefore, a direct comparison for these numbers cannot be made to the general populace at large in the same way as a one-shot self LGBT identification can with national studies.

So, while I cannot point definitely to the fact that derby is not a factor in changes of sexual desires I can say with certainty that the high LGBT inclusion rate does expose people who may have otherwise not been exposed to LGBT culture.

That said the VAST majority of people who came in to roller derby tend to be people who are involved with someone external to roller derby. This holds true for both people who are and are not in the same relationship as when they started becoming involved in roller derby. The chart below is one you can play with and see exactly who ends up with who. You can see specifically who ends up with who over the course of the average derby career.

Now for the interesting results!

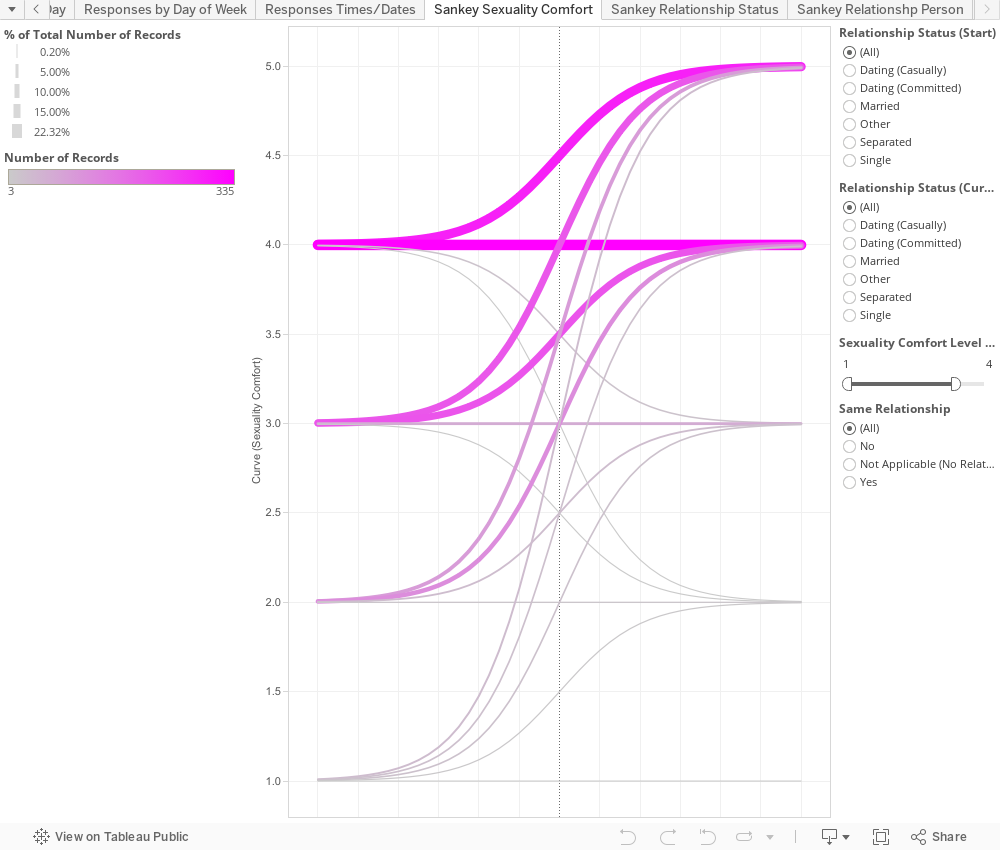
One of the most surprising results that came out of the data is that younger skaters exhibited a greater growth in "comfort" in sexuality. Skaters in their late teens or early 20s, particularly, showed significantly higher comfort levels across the board, with generally all skaters involved in derby showing an increase in comfort regardless of age. Given the high rate of LGBT suicide and suicide attempts this may point to roller derby as one of the most inclusive and positive contact sports LGBT sports youth can participate in. Inclusion and acceptance in the culture of derby may literally be a lifesaver for young LGBT youth. From a purely personal perspective I can tell you as a junior roller derby coach I had a skater come out to me before they came out to their parents. With the large amount of LGBT individuals involved in roller derby the sheer likelihood of getting an understanding coach or themselves an LGBT individual is astronomically higher.

Here is the chart showing the rate of change in comfort by age (orage is pre-derby, green is current):



Below you can see the chart on increases in comfort of sexuality. I removed "5" as a start because almost 50% of people started and ended with a "5" in comfort so I just wanted to see how much and what percentages the increases were as an aggregate:


I'm still working on an academic paper to submit to some journals regarding this research (if you have suggestions those of you from academia I'd love to hear them!). In the meantime I'll likely parse out posts about further results findings throughout this blog (which I'll add links to the end of this post as they come online).

The other big thing I can announce is the next iteration of the survey. I won't go into a ton of detail but I've decided to attempt to make it longitudinal based on people who requested to be contacted with results of this survey's analysis. If you chose to be contacted with results last time (approximately 41% of you), please use the same email address as a contact point this year so I can link data year to year. If you didn't elect to be contacted previously but would like to be part of the longitudinal study please leave a note in the "Final Thoughts" field saying you'd like to be included and I'll try to match country / state / birthday / league type.

I encourage you to take/share out the new survey via this link: https://goo.gl/H6Sib3

As always if you have any questions or concerns please email me at inform8n@gmail.com or message me on Twitter @wjking0. Thanks again for reading and for continuing to help us all understand the impact Roller Derby has on lives both around the block and around the world!

P.S. I titled this "Preliminary" since it's prior to publishing a paper on the topic with more in depth analysis. I also tend to publish a little more on this topic as the time goes on, including a TL;DR version that I'll link to here eventually.

Thursday, February 18, 2016

Dead Drops


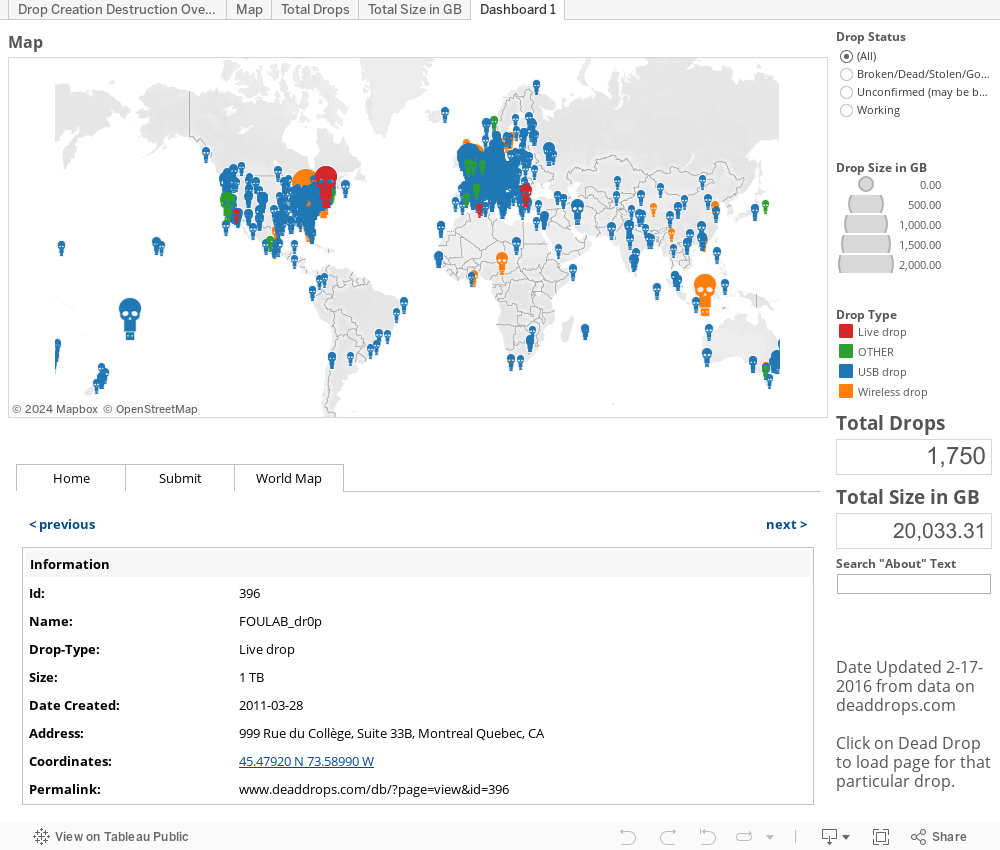
I've heard about Dead Drops for a while but it wasn't until someone posted a link to the site DeadDrops.com with a link to their database (which was the source-material for this viz) that I really took notice.

It's interesting that dead drops would be created (by-and-large) the way they are as they seem to be ripe for people breaking on accident as they're attached to walls or just people breaking out of maliciousness.

I didn't do anything wild with this except for show that the total number of drops currently in existence is a LOT smaller than the total number listed on their site with only 791 working out of 1750 total. Meaning that since November 2010 when this project started more have failed in the last 6 years than have continued to exist. Thanks to spurts of activity in 2013 and 2015  there is are still some positive results that overtake ones that have been marked as non-working. I considered doing some fancy date calculations to show dates for unsure or disabled ones at their "change" date... but honestly I'm just working on this so I can have something to take my mind off the relationship study which has drawn most of my focus over the last week or two.

I considered this my little visual palate cleanser! =) Enjoy!


Friday, February 12, 2016

Career Salaries Unemployment by Major Updated:1-29-2016


My friend Lauren Weaver (creator of the AMAZEBALLS Lexington Mural Map Project) sent me this little fun dataset... and having a chat with her the other day I realized I hadn't actually published anything in awhile. I really tell people that getting things out there is better than getting something PERFECT out there and I need to take some of my own advice!

Without further ado here's some interesting statistics that are from the Federal Reserve Bank of New York's stats on "The Labor Market for Recent College Graduates interactive web feature".


Friday, November 6, 2015

KKK Locations and Concentration in the United States

Mr. Terrific vs the KKK

I wanted to originally title this post as "Racism in the USA" but I realized this really only scratches the surface of the different hate-groups that exist in America (sadly). =/ This is definitely one of the worst datasets I've ever looked through. *pukes*

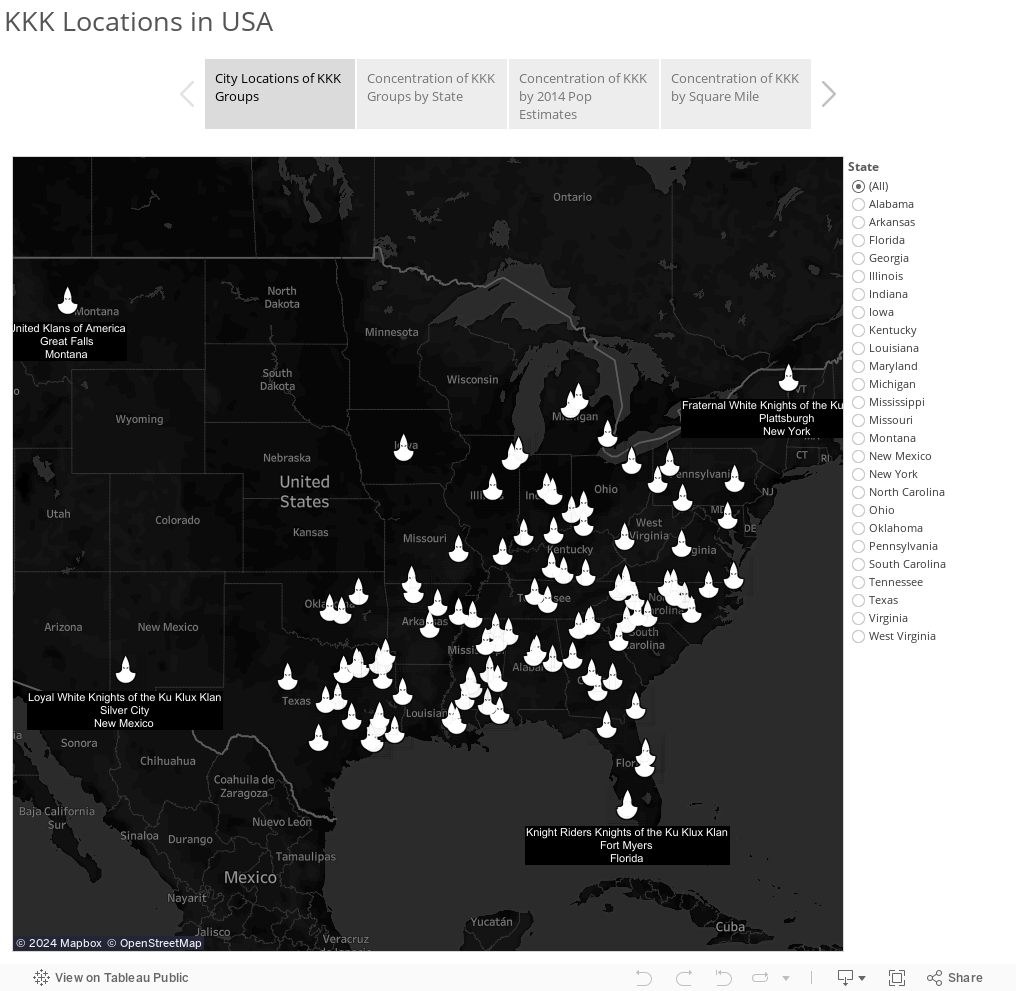
This information came from a cursory scrape of the data dump from Anonymous last night 11-5-2015. I decided not to map the individual people's data as those wouldn't give us the succinct kind of picture we get when we look at the data as far as groups in several different ways.

I used Tableau Stories as I felt you can step through the data in a more meaningful way. I'll outline in below then you can dive into the data:

  • First off you can see the actual city locations of KKK groups.
    • You'll notice a STARK lack of anything in the western United States.
  • Secondly there is the concentration for NUMBER of KKK groups per state.
    • Wow... umm... yikes Texas. =(
  • Thirdly is the number of PEOPLE PER KKK group (not people IN each group).
    • I used 2014 Population Estimates based on the actual 2010 Census numbers.
    • OK... now yikes Mississippi!
  • Lastly is the square miles per state divided by number of KKK groups.
    • Here you'll notice several states previously not very dark become much more prevalent (again casting larger states like Texas in a better light).


As always if you have questions/comments/concerns please contact me at @wjking0

Friday, October 30, 2015

Spoooooooooky "Ghost" Photos by City/State


The thing about superstitious beliefs is that it's hard, REALLY HARD, to get a set database to work from to try to sketch it out visually. That being said the closest thing I was able to find as far as any sort of database of spooky events with significant numbers I could use to visualize creepy activity is the Ghosts of America site.

I wanted to scrape their entire archive for every single city but I realized that I'm almost SURE their site is hand-written so I wasn't able to get data extractors to crawl it successfully. Instead I figured out the best laid our part of their site for scraping purposes would also be the part I would want to use. So I went ahead and scraped the "photos" section of the Ghosts of America.

The state results are as follows:


For a city-level look here:


As you may have been able to tell at this point there are lot of "questionable" ghosts photos out there... ;-) As usual if you have any questions or concerns hit me up on twitter @wjking0 and I'd be happy to talk them out! In the meantime just remember most ghosts are quite what they seem....


Friday, October 16, 2015

Kentucky WIC Usage 2000-2013


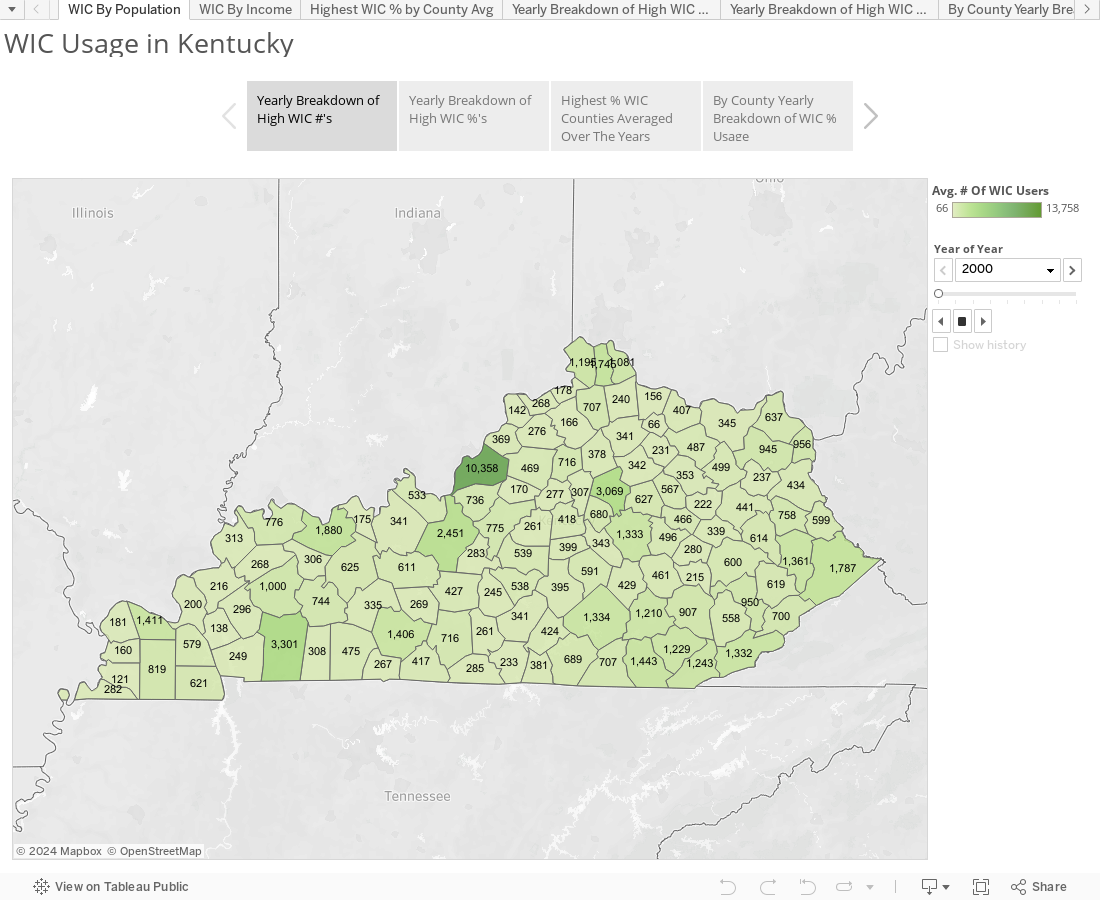
As a non-native Kentuckian I wasn't sure what WIC usage looked like in this state. My assumption was generally that WIC was something you'd see more of in large developed cities. It turns out I was wrong.

The data used came from the following:


For the calculations I applied the numbers to total calculation and not to subgroups for women or children under 18 so usage percentages for those may be higher but I don't have the WIC info regarding numbers of mothers vs children utilizing services so I didn't want to further muddy the numbers.

Also for these calculations I applied the 2000 census amounts to the 2000 WIC numbers and then for the 2006-2013 WIC numbers I used the closer 2010 census numbers as populations estimates for most regions were fairly stable over that time period.


As you can see, the large urban areas of Lexington and Louisville (Fayette and Jefferson Counties respectively) have fairly low usages of WIC (<2%) while areas particularly in eastern KY you can see have fairly high/consistent usage. I haven't done cost analysis yet but once the USDA fixes their website and I can get some more in-depth numbers I should have some more data to play with.

As usual hit me up at @wjking0 if you have any questions or concerns or just want to talk about public data!

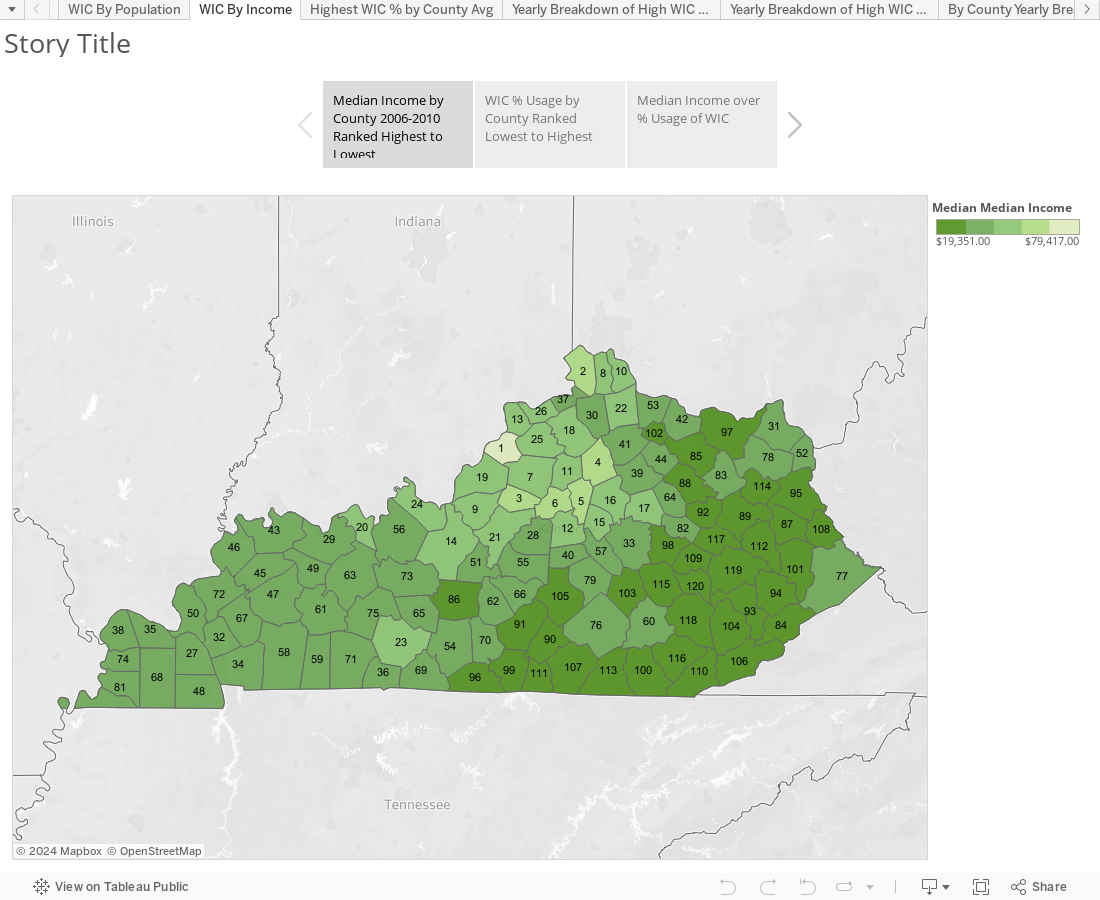
EDIT: I've added the second dashboard/story as there was a request to look at the comparison of WIC % to Median Household Income so I crunched that out real quick:


Thursday, October 15, 2015

Can We Build An Ethical Car?


This post is a little bit removed from my normal dataviz stuff but given Tesla's announcement yesterday now is the time for this post to come out! Besides, it's finally a chance for me to get to use my Philosophy degree!

I've been thinking for the last several years what the driverless-car revolution would really be like. When the first couple of driverless cars completed DARPA's car course in 2005 and the future became much more real an article came out (which I've sadly lost the link to) that made some very salient points which I'll try to summarize now: 
  • The majority of cars spend their time idle/parked.
  • If the price of driverless cars is prohibitive, wouldn't it be easier to spread that cost out with some neighbors since the car is only occupied for a brief time by each person per week?
    • The downside of that is most people need cars are certain times to get to work on time, home, to pick up the kids from school, etc.
  • Instead of splitting the cost of 'your' car with the neighborhood, what if instead you subscribed to a car 'service' (much like you currently subscribe to Netflix vs owning all your movies now)?

The ultimate point is that, in the somewhat near future, I think we can all agree that a large portion (if not all) cars will become driverless. They will be controlled by certain AI and algorithms that will enhance their safety features and reduce car-caused fatalities by a VAST number. We can already see that the initial rollout of driverless cars from Google have been in accidents where other drivers are at fault.

Here's the thought experiment I want you to conduct:

There are  two autonomous cars are next to one another on a bridge. The unthinkable happens and a large item falls off the back of a semi truck landing directly in the path of one of the cars. Let's say both have at least 1 person in them and there is a 100% of ONE of the vehicles inhabitants not surviving the crash (I think we've all seen Final Destination...).

OK, so who gets to live? Software has to make that decision. Let's assume that both cars have the same AI/decision-making software in them (we'll get to a different idea in a sec). We can assume that in this point in automated driving cars would communicate with one another for enhanced safety such as warning about large obstructions, potholes, etc. What if one of the vehicles that was going to crash had a single person in it and the other vehicle had a family of four?

We would think at that point the cars would do a math to calculate that > lives = better! What if the single individual was someone working on ground breaking research into cancer treatments? Do we want cars to rank our lives? If you recall this type of software biasing for life/death was one of the crucial turning point (spoilers) for Will Smith's character in the movie iRobot.


In the beginning of the film Will Smith's character has a car accident and a robot AI jumps into a freezing lake as his car is sinking pulling him (and NOT his young son) to safety despite his protests that the robot should save the son instead. Will we get to choose? Will future cars ask for our preference for these types of ethical situations? Could I say, 'In the event that my car is spinning and going to collide with an object please make it on my side vs that of my daughter' ? Could we value high numbers of lives over our own or will the software choose for us?

Additionally... let's return to the idea of differing software. Would different manufacturers have different ethical applications running in their cars? If two cars were on a bridge from different auto-makers would they fight over whom gets to live?

Anyway... I know it's not my normal dataviz thing but I wanted to post this out here to get at least a small number of you all thinking about what driverless cars mean for robotic ethics. It's a HUUUUGE deal (in my opinion) and I figured I should open up a dialogue about it! Comments are always welcome on my twitter @wjking0 so shoot me your thoughts and let's have a discussion about car AI ethics!