Friday, April 17, 2015

Stupid Broken Leg (aka GIVE ME THINGS TO VIZ!!!)

A little back-story...

Sunday April 5th I was involved in an accident that left me with multiple ankle breaks and a fibula break in the upper section of my lower leg (close to my knee).
Thursday April 9th I went in for surgery on my leg/ankle (yea, it was pretty bad) and they put a plate and some screws in to keep my leg together.
I'm currently on FMLA (Family Medical Leave Act) and I'm unable to be at work until I go back to the doctor (which is currently not until the 28th for those keeping count).


The upshot is I have a LOT of spare time on my hands right now and not much of anything to do with it!

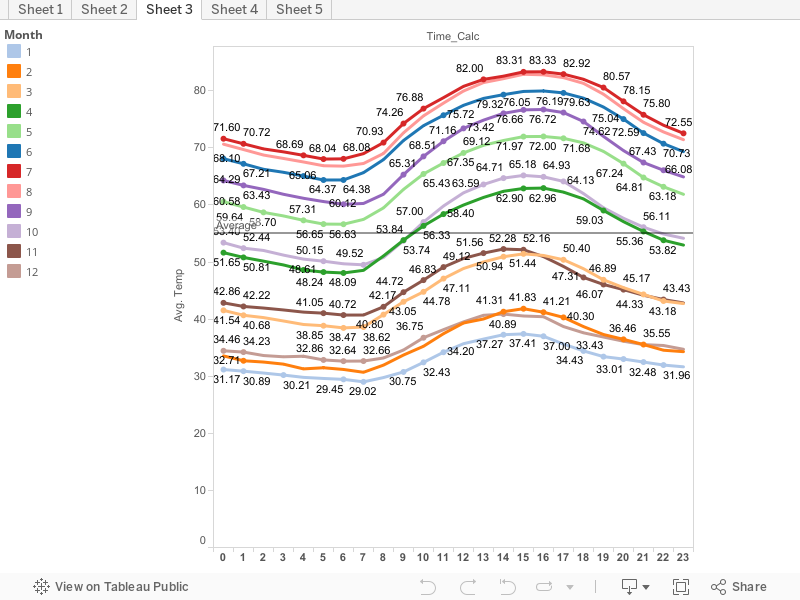
So since I'm laid up and to keep my mind occupied I've been working on all these data visualization projects. Sadly due to pain medication focus has been a real issue... fortunately it has allowed me to really flow from project to project without getting worried about it. The other day I thought "man, it's nice (looking) out today"... so I started collecting weather data. Now I have the ENTIRE history of Lexington's weather hour-by-hour for the last SIXTY-FIVE YEARS (that's 569,790 measurements for all you math nerds out there). So far one of the neatest things I've made is this:


This is a view of the temps in Lexington, KY on average hour-to-hour by month. I felt it was just a pretty graph to create but also informative. We have about 5 months of the year where the highs are consistently above average temp and 5 where they are consistently below average temp. With two months straddling the above/below quadrant. Anyway... I'm also working with some enhanced data from Flat Track Stats and looking to do some neat work with that soon as well.

Give me ideas people! I need things to visualize and make pretty!

Tuesday, March 10, 2015

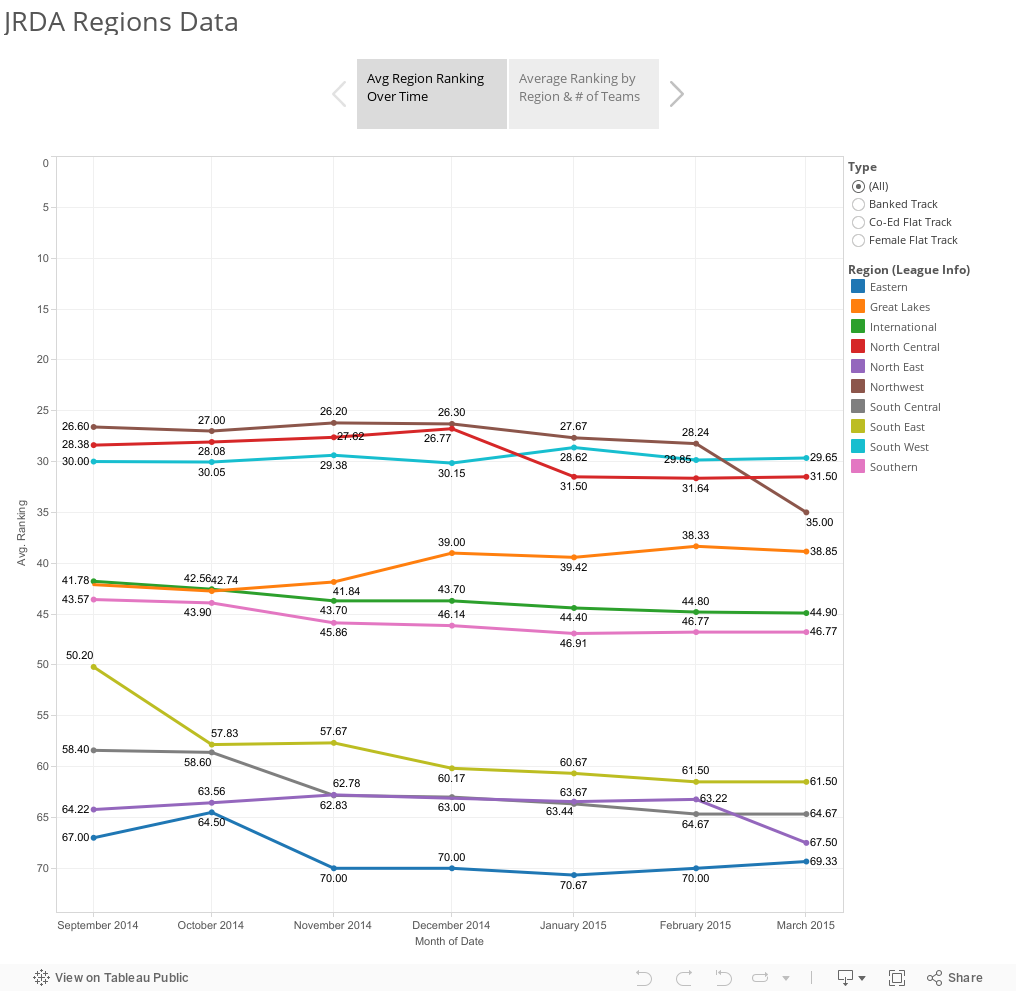
JRDA Rankings (Unofficial) with Tableau Stories

WARNING! Big interactive graphs ahead! You probably want to look at it on a desktop or tablet and NOT your phone!


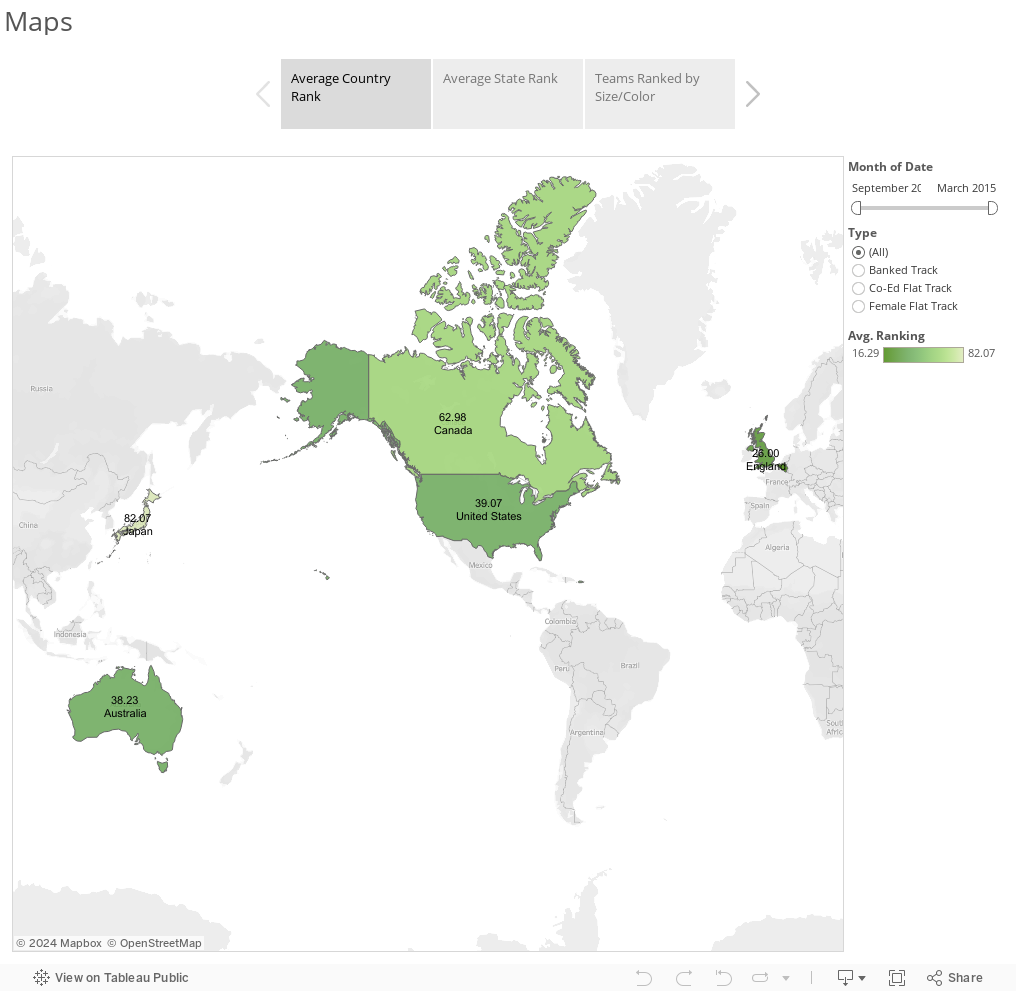
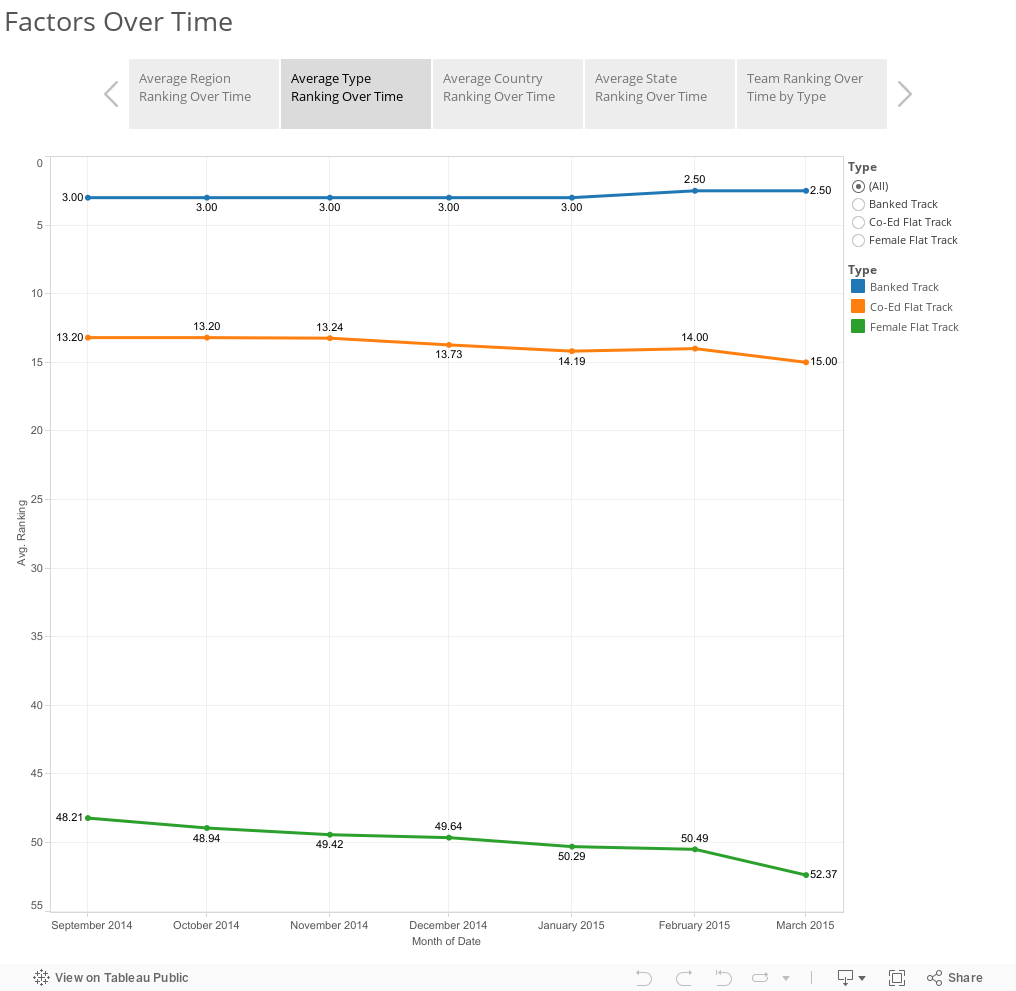
First off let me state that the views/rankings in this are NOT those of the JRDA but based on the JRDA by Junior Derby News. As some of you may know I coach an AWESOME group of Junior Roller Derby Skaters known as the Sixth Street Slammers here in Lexington, KY. Rankings from the JRDA only have one set available (Feb 2015) then I saw a post about Junior Derby News - The 4th Whistle and realized they had rankings going back at least 7 months. The current format started in September 2014 but stays pretty consistent. Anyway... on with the graphs!

Also a HUGE shout out to Aval Knievel from the Slammers for helping out with the data gathering! <3

Keep in mind that ONLY teams that are ranked (at any point) are represented in this data. 

Current Dates on these are: September 2014 - March 2015 (Current)


Sunday, February 15, 2015

Roller Derby Relationship and Gender Study Questionnaire

What’s this article about?
I'm writing up a little brief to answer some FAQs regarding my newly-published Roller Derby Relationship and Gender Study (located here: http://goo.gl/yF3Qr9 ). I'm looking at the way time spent in roller derby changes who we are, who we date, how we see our bodies, our self identity and some other key factors.

Who am I?!

IMAG0082.jpg


I'm a player/coach for the Men's Roller Derby of Kentucky team The Dark Horses and a coach of the Central Kentucky Junior Roller Derby team the Sixth Street Slammers as well as being a photographer for leagues all over the region and all over the world at several tournaments. In the real world though I do data analytics at the University of Kentucky.


The Story
The story is that this is actually v2.0 of a survey a friend of mine originally did who wanted to write an article about the results and asked for my help disseminating the original survey. I agreed to help her and she agreed to share the raw data with me to analyze once she closed the survey. The problem was she used free-form text entry on her survey which made it INCREDIBLY hard to classify/categorize!
Ex. “How long have you been involved in roller derby?”
“3 months”
“2.5 years”
“6 seasons”
“4”
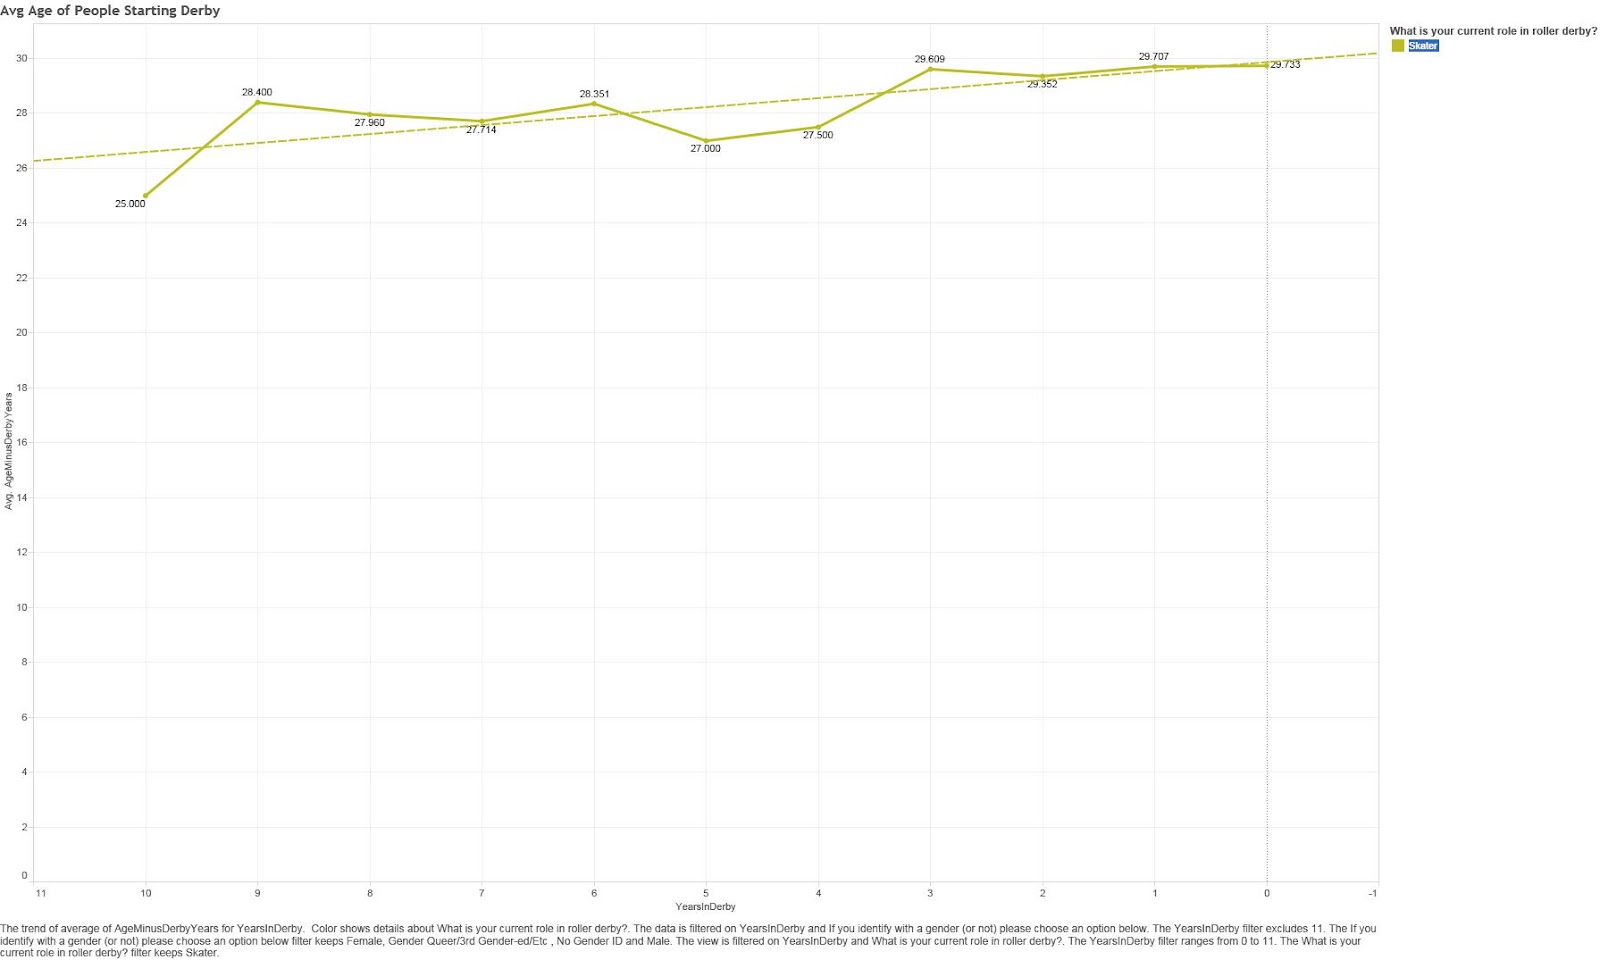
You can see how this was problematic to analyze. My friend and original creator of the survey saw the terror she had wrought and decided that it wasn't worth sifting through to write an article about. Still, after about two weeks of working with the data I was able (literally after hand-coding around 600+ entries into categories) to get some analysis going. I couldn't deduce much but most of the findings were unsurprising. Most people do NOT change their gender preferences because of derby. What I DID notice in the original study though was that people that identified as anything other than "Straight" tended to 'come out' more while playing derby and reveal what they considered to be their 'true selves'. That made me VERY interested in expanding and refining the survey to make it much more nominal and more easy to analyze. I talked to my friend and she said it was my baby if I wanted it so I took it and have been refining it and trying to get it as inclusive as I could. I'm particularly interested in things regarding changes in gender identity/preference and the number of committed relationships people have and whom they have them with. Strangely enough in my early analysis of data from v2.0 survey I've found some interesting trends not related to gender and identity but just derby as a whole. Particularly that the average age of derby skaters seems to be (slightly) rising (see graph below).
Avg Age of People Starting Derby (Skaters).jpg


What am I going to do with all of this data?!
One of the big questions people ask is 'how does this help the derby community?' My big goal though is to dispel rumors and preconceived notions with cold hard facts and analytics. One of the common jokes around leagues I'm around is that when someone's marriage falls apart that "the Derby Divorce Machine" strikes again. While funny I was also curious if the rate of divorce was higher among derby than the general populous and try to deduce why etc. As far as where I intend to publish the information I run a data visualization blog at http://bourbonandbrains.blogspot.com/ where I'll likely publish some visualizations that people will be able to manipulate themselves and play with to find their own little nuggets of truth. The second phase of analysis is that one of my dear friends in derby is also a professor here at the University of Kentucky in Social Work and she asked if I could include some of the questions about comfort level with body image and sexuality in there to give it some 'umph' research-wise. She and I are hoping to write at least one, if not more, academic papers out of this data to publish out in some sociology journals.

Who has access to these results?
Ultimately only 2 people have direct access to these results and they will not be shared in any public way with email addresses (if you chose to put those down) or any sort of identifiable information. I'll likely be stripping out birthday as well since I've already used it to calculate "Age" and "Original Age When Joining Derby" based on the two date fields.

Finally
I'm very VERY excited about the amount of data coming in now and I've been making notes for refinements and I'll likely put out another survey of similar nature in about a year or so (to keep the data fresh, discover new data, and answer new questions and fix the survey for those with issues answering in a way that suits their lifestyles). I would still like more international participation and participation from skaters 21 and younger (even down to 15-16) but that requires tapping into a demographic that uses things like instagram and snapchat where it's really hard to deliver a survey link! :-/ If anyone can think of a good way to get to this younger demographic I would LOVE to hear about it!
I'm more than happy to answer any questions or concerns anyone has so please send them my way via my email at inform8n@gmail.com or on twitter @wjking0 I want us to better understand ourselves as a derby culture and improve ourselves through self-knowledge.

Much derby <3,

P.S. Any site is allowed to reproduce or publish this page as along as a link to this original article is included.

Monday, February 9, 2015

Where's Waldo?! A Search Algorithm!


I have been feverishly working on a few HUGE viz's coming up so in the meantime I wanted to share something I thought was super fun (if childhood spoiling). A Where's Waldo search algorithm!

Here is the link to the work which is pretty awesome:
http://www.randalolson.com/2015/02/03/heres-waldo-computing-the-optimal-search-strategy-for-finding-waldo/

And here is something to check out to tide you over until my other big Viz's are complete!


Thursday, January 8, 2015

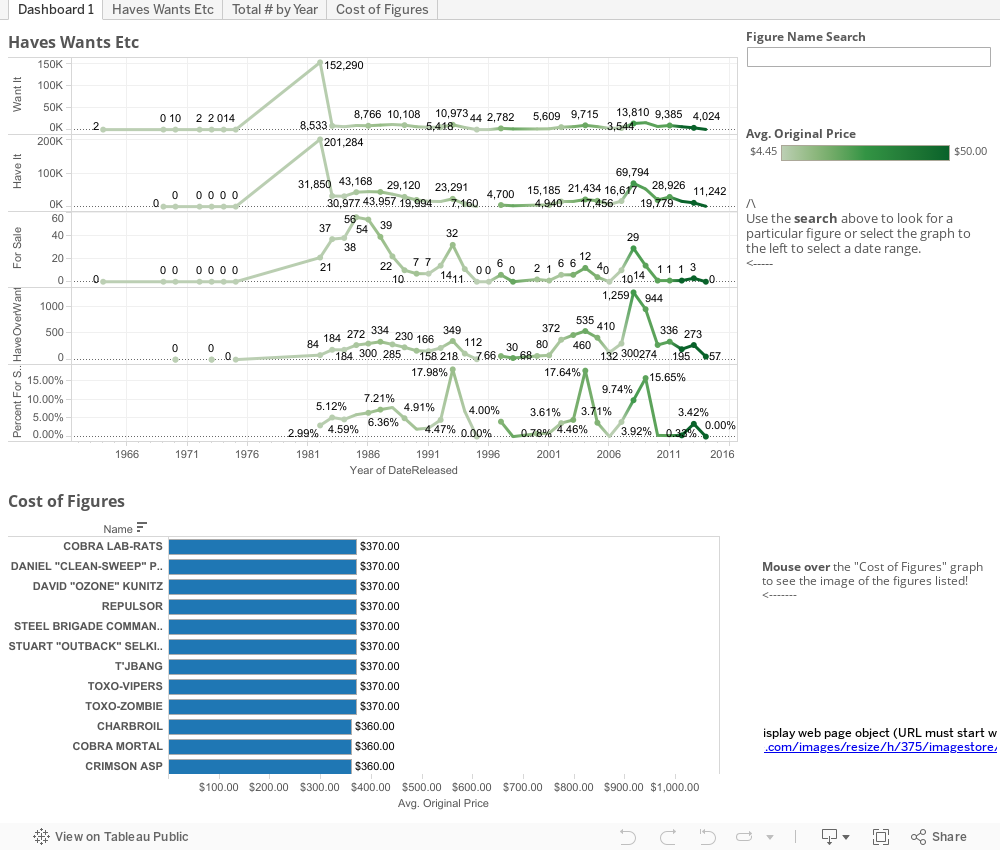
G.I. Joe Figure Viz (because I had a weird dream)...


Do you ever have one of those dreams that feels SUPER real? I had one of those the other night. Ironically I was dreaming about hanging out with my old friend James and his wife and newborn when James was asking me about my new data collection methods. Then (in my dream) he surprisingly asked, "Oh my god can you index GI Joe figures too!?" "Umm... sure, I guess," I replied.

James (on his B-day) and his cute daughter! =)


I then woke up to find out James birthday was literally the next day. I poked around trying to find a nice GI Joe DB (because I figured if I dreamed about it I should probably do that!). I came across www.yojoe.com which has a really great database of Joe's located here: http://www.yojoe.com/action/

I did a quick scrape and got to work playing around, the most interesting thing to me is the "Haves/Wants/Sales"... NO ONE is selling their 1980's Joes... the 90's ones are WAY more fair game. =)  Anyway, because I had a dream and I hadn't published a viz in a while I wanted to just kick this one out while I put the polish on a few others I'm working on that will be more in depth. So here ya go, my birthday present for my friend who never really asked for it on his birthday because I had a dream (if that isn't all confusing enough!)!


As always if you have any comments/suggestions hit me up on twitter @wjking0.


Monday, December 15, 2014

ThinkGeek Catalog Details Data Analysis (What's on SALE!?)

It's time once again for some holiday shopping! I'm assuming if you're reading this blog you're probably of the nerdy variety so you'll probably appreciate the same kinds of things that I do in a consumer sense.

Import.io LogoSo I got thinking about where fun places to buy things are. I've recently fallen desperately in LOOOOOVE with Import.io. I'd been playing with a few little data scrapes but I finally decided to put it through some real paces now that I understood better how to train it and analyze the data after-the-fact.

Ah-Ha ThinkGeek! I'll scrape their entire catalog to see what to get for people!


ThinkGeek Logo


A quick scrape (well 4 hours later) we have a total of 3,930 products in our dataset. In the following categories:


  • Computer Stuff
  • Electronics
  • Electronics & Gadgets
  • Gadgets
  • Geek Kids
  • Geek Toys
  • Home & Office
  • Interests
  • T-Shirts & Apparel
  • Tools Outdoor & Survival


I decided to do sales data two different ways, first was to do sales percentage difference. That is to say the percentage off of the full price in a category (color depth denotes number of products in a category):


Finally the big payoff! Scroll over a product to load the product image and click on a product to load the product webpage (be careful not to scroll across another product after selecting one or another product image will load on top and thwart your shopping efforts!):


Let me know what other retail sites you'd like to see analyzed and I'll see what I can do!

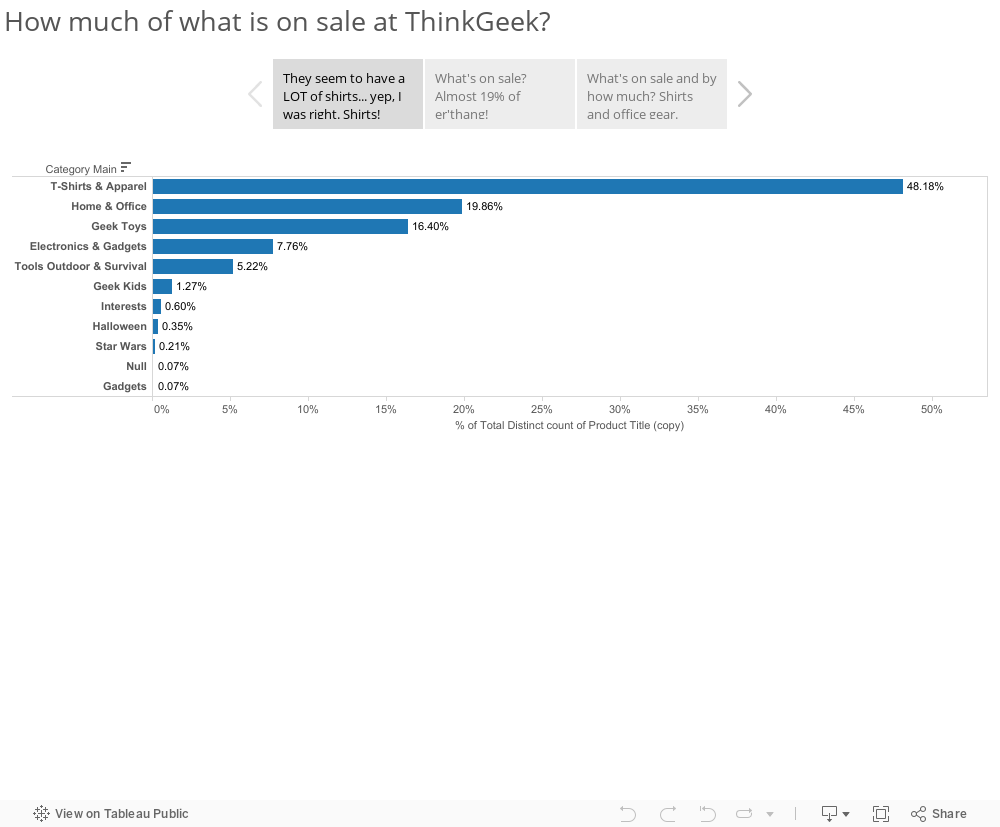
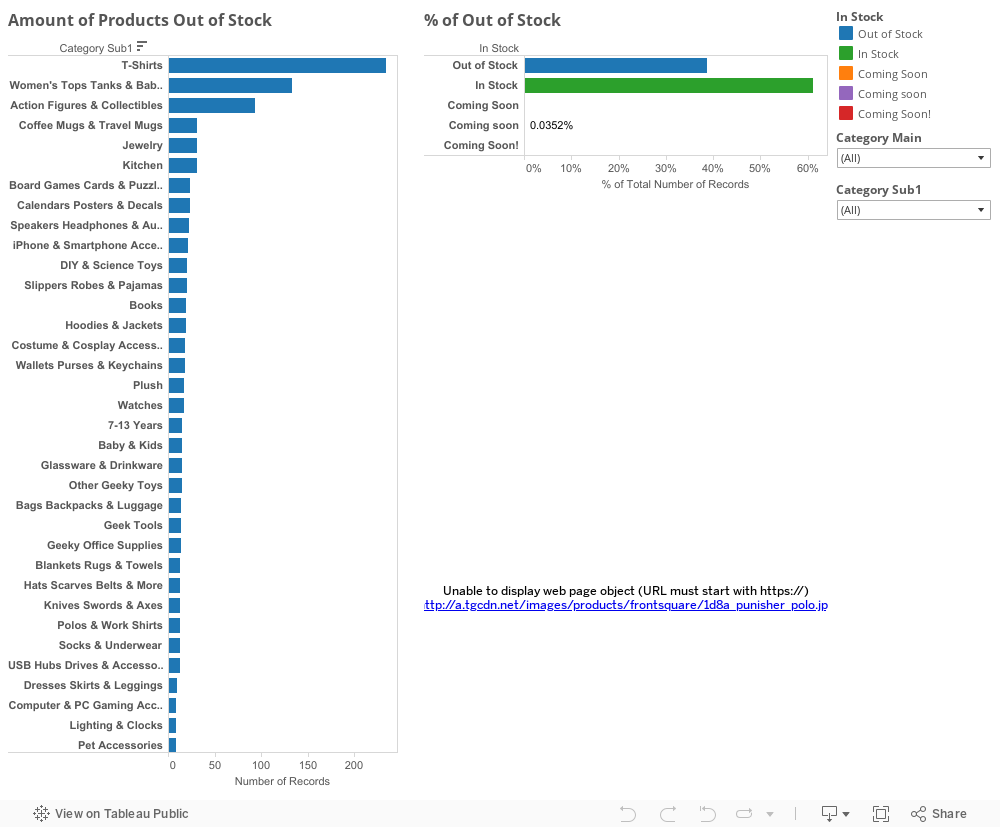
Lastly I figured I'd show the amount of stuff that was out of stock at ThinkGeek which I found to be exceedingly high as well (a full 46% of their total inventory!).


Thursday, December 4, 2014

Crosswalk Data - A Lesson in Finding Exactly What You're Looking For

I enjoy a nice Fall (or even early Winter) walk. I live in the beautiful and vibrant city of Lexington KY. It's a largely urban city so I spend a lot of time crossing crosswalks. Crosswalks have a numerical countdown... I love number problems!


Times obviously weren't a set number so either they're set randomly by whomever is setting them up or there is a pattern. I figured it had something to do with the account of traffic in an intersection (cars/hr or something equivalent). I started looking in the usual places for the stoplight/crosswalk light information I was looking for /r/datasets, data.gov, etc. It wasn't until I started glancing into city municipal data for various larger cities that I discovered that the math was already done for me!

T = d/1.065
T = Crosswalk time in seconds
d = Distance in meters

The 1.065 m/s (3.5 ft/s) comes from a study done in 1982 regarding mobility of pedestrians. Generally speaking the speed of the average pedestrians is around 1.22 m/s but a longer time is factored for walking speed to give time to elderly walkers and pedestrians with mobility disabilities (which accounts for about 15% of the population). So now every time you cross a street you can think to yourself how long the crosswalk (and thusly stoplight) SHOULD be and be able to roughly calculate if that's accurate!


Now given the dataset that I just got access to the other day (upcoming viz VERY soon, I promise) I'm now wondering if I could time it based on light changes to walk to work hitting every single crosswalk at the correct time based on the distance between lights, crosswalk distance, and light timing. It's moments like this that I think I'm steadily becoming this guy:


Like I said, new viz regarding stop light data is coming very soon... 

* Most of the municipal data for this post is pulled from this site: http://www.fhwa.dot.gov/environment/bicycle_pedestrian/publications/sidewalk2/sidewalks208.cfm