I saw a question recently on Facebook that was asked somewhat rhetorically asking the following:
So with all the heroin overdoses I sit here wondering what the overdose percentage is in the states where marijuana is medically approved or legal. Do they have the same trouble with heroin as the rest of the country?
I thought to myself... 'I bet I could legitimately answer that!' I started searching around and discovered that there was a study done just a few months ago that looked at opioid usage in conjunction with state laws for medicinal marijuana. The findings were inconclusive when looked at as a whole but when the researcher looked at the 21-40 year old age group there was a pretty significant decline in automobile fatalities when compared to similar cases in areas where marijuana dispensaries (for medicinal purposes) were unavailable. Link to the full study can be found here.
That wasn't really getting at the core of what I think the person was asking which I see as 'does recreational marijuana's legalization cause a decline in opioid and particularly heroin usage?'
I searched around pretty extensively looking for facts about heroin usage and drug deaths but almost all data was, at the most recent, published for 2014. Most states and municipalities didn't legalize recreational marijuana until 2015 with Colorado being the exception. Even then finding drug related fatalities proved difficult and when I found drug-specific totals they were always at the national level. The upshot is that this search for data turned out to be WAY more difficult than I anticipated! The big problem was that arrest data or death data was just not as recent as I needed it to be to compare multiple states.
Suddenly I found out that the CDC keep records of "drug poisoning deaths" (overdoses). I found this article from the Colorado Public Radio which finally linked me to the data I needed! I started looking at the CDC blog... man this graph-style looks so famil-IT'S TABLEAU PUBLIC! Crap! I had already pulled down the raw data myself and started doing some work showing that the trends in Colorado were indeed a little worse than the national average of age-adjusted deaths by drugs.
That's when I noticed that the CDC and myself had built almost the EXACT same dashboard! (Screenshots below):
On the plus side it made me feel pretty good that I was making similar design choices as someone who's employed by the CDC to do this type of dataviz!
 |
| Me looking for the right up-to-date data |
Suddenly I found out that the CDC keep records of "drug poisoning deaths" (overdoses). I found this article from the Colorado Public Radio which finally linked me to the data I needed! I started looking at the CDC blog... man this graph-style looks so famil-IT'S TABLEAU PUBLIC! Crap! I had already pulled down the raw data myself and started doing some work showing that the trends in Colorado were indeed a little worse than the national average of age-adjusted deaths by drugs.
That's when I noticed that the CDC and myself had built almost the EXACT same dashboard! (Screenshots below):
 |
| The CDC's Dashboard they created, click image to go to blog post about it! |
 |
| The Dashboard I designed before seeing theirs! |
On the plus side it made me feel pretty good that I was making similar design choices as someone who's employed by the CDC to do this type of dataviz!
Now the thing has become 'How can I salvage this or make it better?!'
| Thinking how I could improve this to salvage the weekly #1yearofviz challenge! |
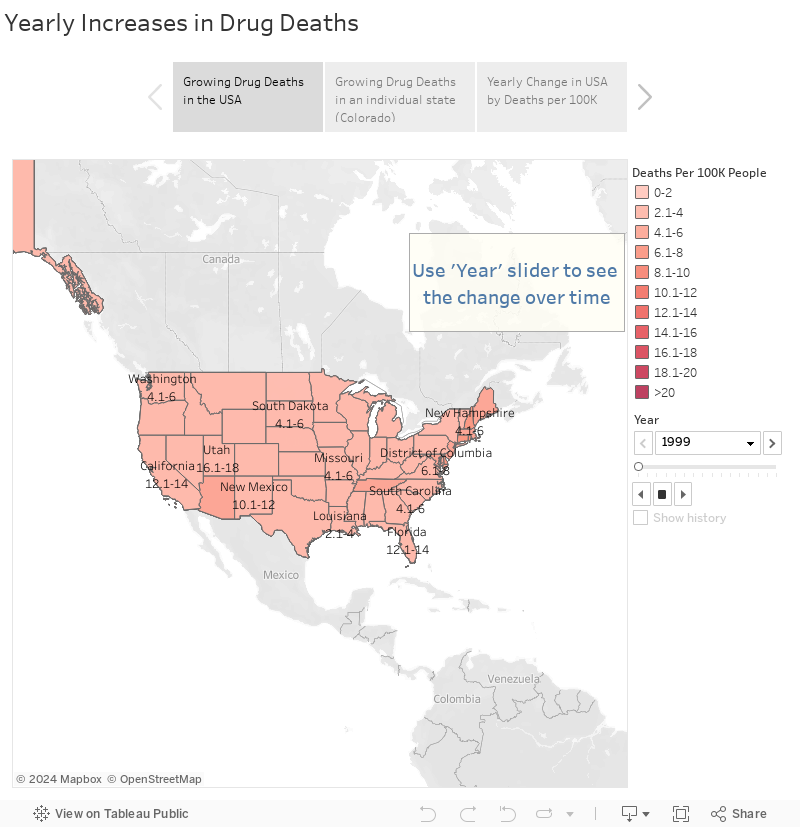
I know I'm replicating some effort here but I think it's working looking at the way I lay out the map of drug deaths over time country-wide and state-wide. Particularly worth looking at is the last page of this Tableau Story where you see the national averages slide from the left to the right side over time:
If you'd like to see how your state looks compared to the same time nationally by state averages surrounding it you can use this dashboard here:
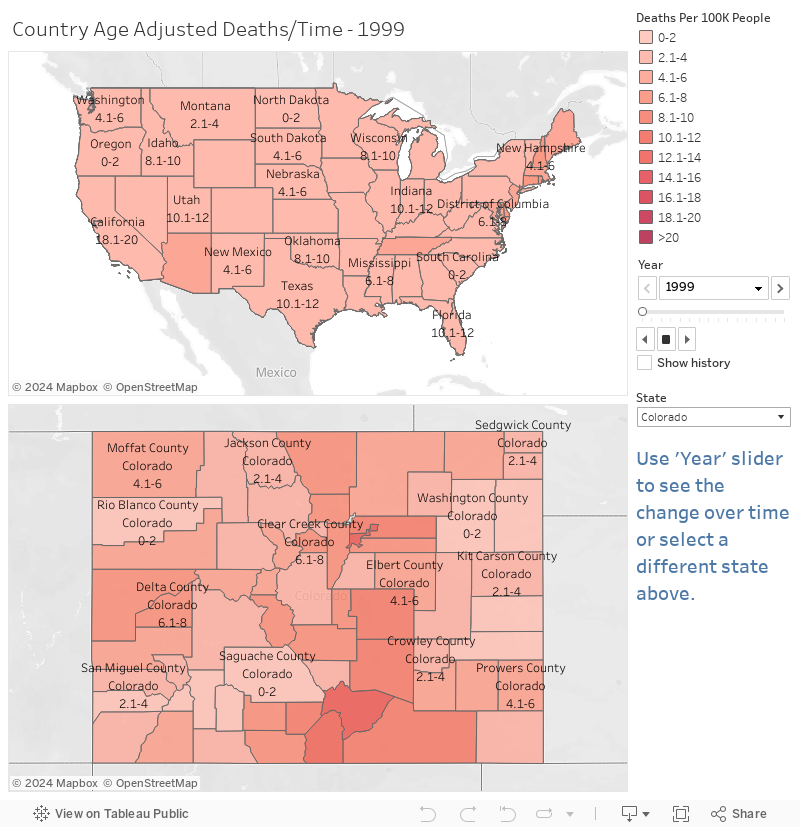
Of course most of this can be viewed in the CDC viz and I didn't want to duplicate too much effort....

The CDC was focused on how drug deaths have been steadily increasing year-to-year so I decided to change up the bottom graph to show relative change over time... what PERCENTAGE were drug deaths going up year-to-year and is there any difference in Colorado in that regard? I then came up with the following dashboard:
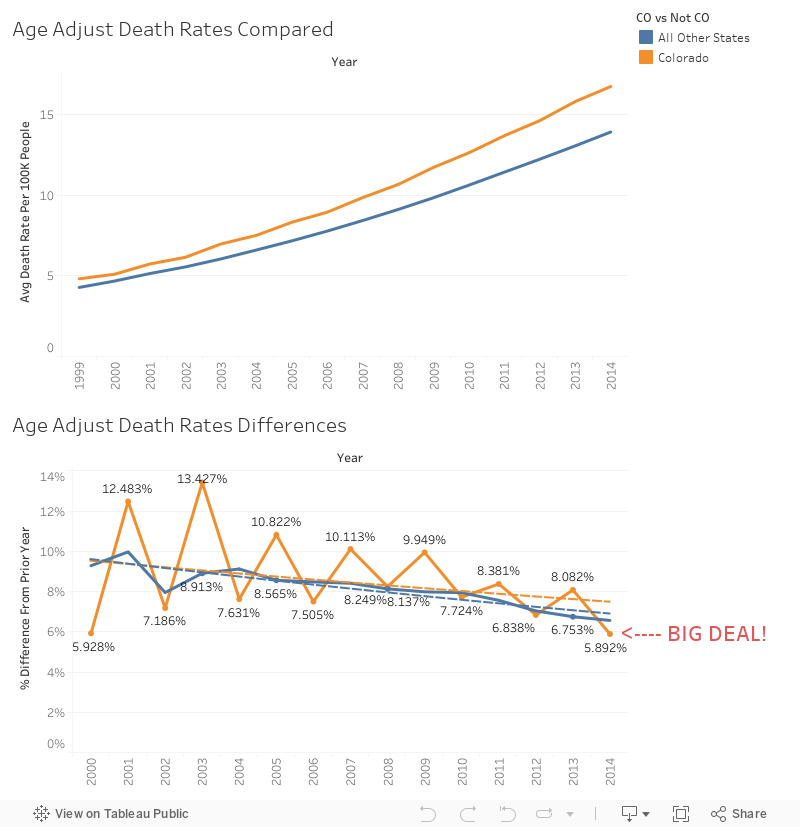
Now while this is just one year's worth of data the lower uptake of drug-related deaths in Colorado in 2014 is SIGNIFICANT. This is officially the slowest increase since 1999 and WAY below the national average! This is a key thing as Colorado has been (as mentioned previously) in the top states for drug related deaths per capita for the past few years. One would tend to think that trend upwards would continue as it has nationally but in 2014, while it DID INCREASE, it was the smallest increase in 16 years! Now correlation doesn't equal causation but this data can be revisited later for other states who adopted recreational marijuana policies in 2015 when that data becomes more readily available! The answer to our earlier question if it reduced opioid/heroin deaths... that's hard to say but as those are the most likely cause of death currently among illegal drugs we can assume that those drug overdoses were reflected in this reduced increase in numbers.
 |
| Me at my friend's places after they go to Colorado for "hiking" |
I hope you round this data interesting. If so please comment/like/share it out on social media. As always if you'd like to say something feel free to comment below or to hit me up on twitter @wjking0. If you have a question you'd like Viz'ed out as part of my #1YearOfViz please hit me up and let me know! Thanks to James for the question this week and I'm sorry more data wasn't available to get a more robust answer!