Friday, March 17, 2017

Urban Dictionary - Top Words (NSFW Text!)


This is part of my #1YearOfViz series! Check out the archive here: http://bourbonandbrains.blogspot.com/p/one-year-of-dataviz.html

WARNING! If you're offended by "bad" language steer clear of this viz!

Originally this week I was going to work on a viz about Girl Scout Cookies.... I was hoping to find some sales numbers... then after some brief searches I realized that was a pretty fruitless endeavor and the closest I could come was looking at the google trends for the different Girl Scout Cookie names. While interesting... isn't exactly dataviz worthy.


So switching out from the totally mundane and safe for work topic of Girl Scout Cookies (THIN MINTS FOREVER!)... I flipped my mindset entirely and decided to look at Urban Dictionary. I was thinking back to an article that I read about when IBM's Watson was fed Urban Dictionary to help learn slang and ended up having to have it purged as the AI wouldn't stop swearing as part of it's normal speech pattern.

I considered attempting to scrape it but wasn't sure how large a scrape that would be... when low and behold I found someone had already done the work for me! Huzzah!
I'm too lazy to scrape that much data!
I've compiled some quick facts I've learned about words... which is a hilarious sentence to write. I'll link to sources when there was one otherwise it was something I learned through the analysis of the data:
  • Merriam-Webster 

  • Urban Dictionary 
    • Avg 1.277 definitions per word
    • Avg word length 10.05 letters
    • Median word length 9 letters
    • Total number of definitions is 2,079,261
      • This contains phrases as well as words
    • 1,457,980 Unique Words/Phrases

Before we actually get into the data remember that I just manipulated the data into the viz and am not the author of any of this. If you're easily offended by slurs or bad words... now would be the time to check out another viz!

I limited the whole viz to the top 10,000 words/phrases by their sum difference between their Upvotes and Downvotes. Some had multiple definitions and so the list looks slightly different if we use Total instead of Average for the Up/Down difference (in that instance "Sex" becomes the top word instead of the second word). CLICKING ON ANY WORD will cause a pop-up to that word so you may need to disable pop-ups to go out to Urban Dictionary from within the viz!
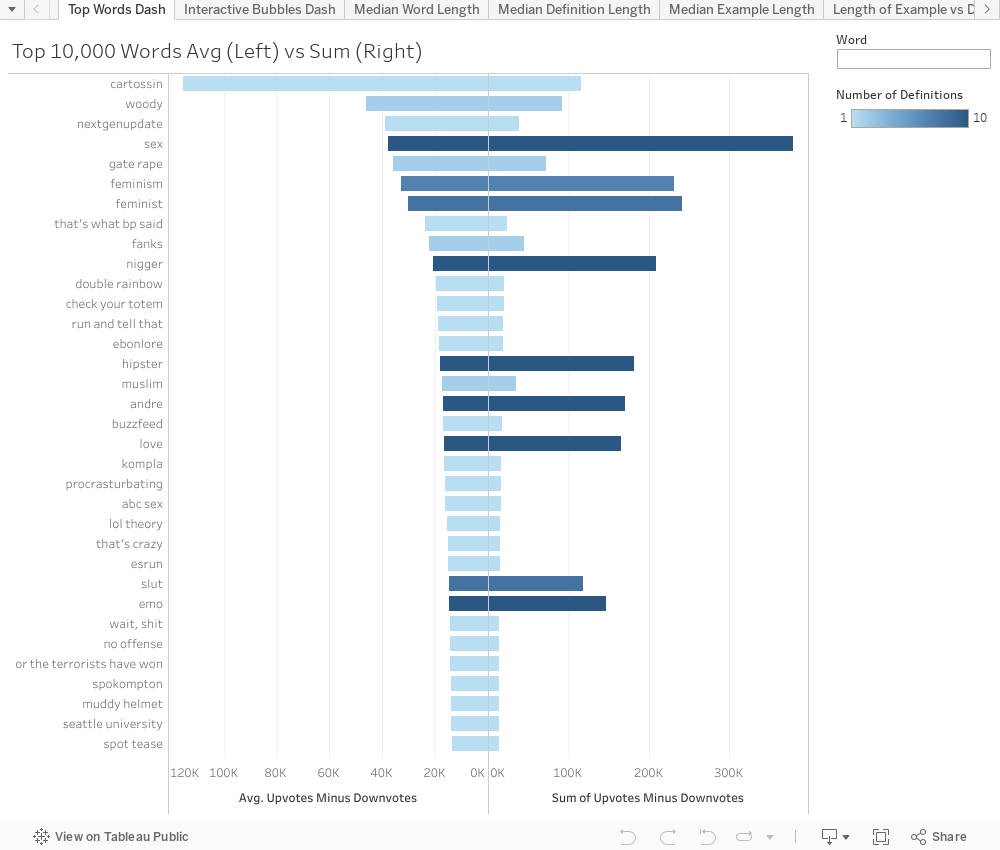


Now if we compare that to the trending words on Merriam-Webster you may see a SLIGHT difference.
How I picture the people at Merriam-Webster right now.

Now this next viz is really just to let you play around and reformat the data however you'd like. You can change both X/Y/Color axises to answer some of your own questions you may have. I'm still limiting this to the 10000 words... ALL words were just too many to really manipulate the data and click around to learn definitions!
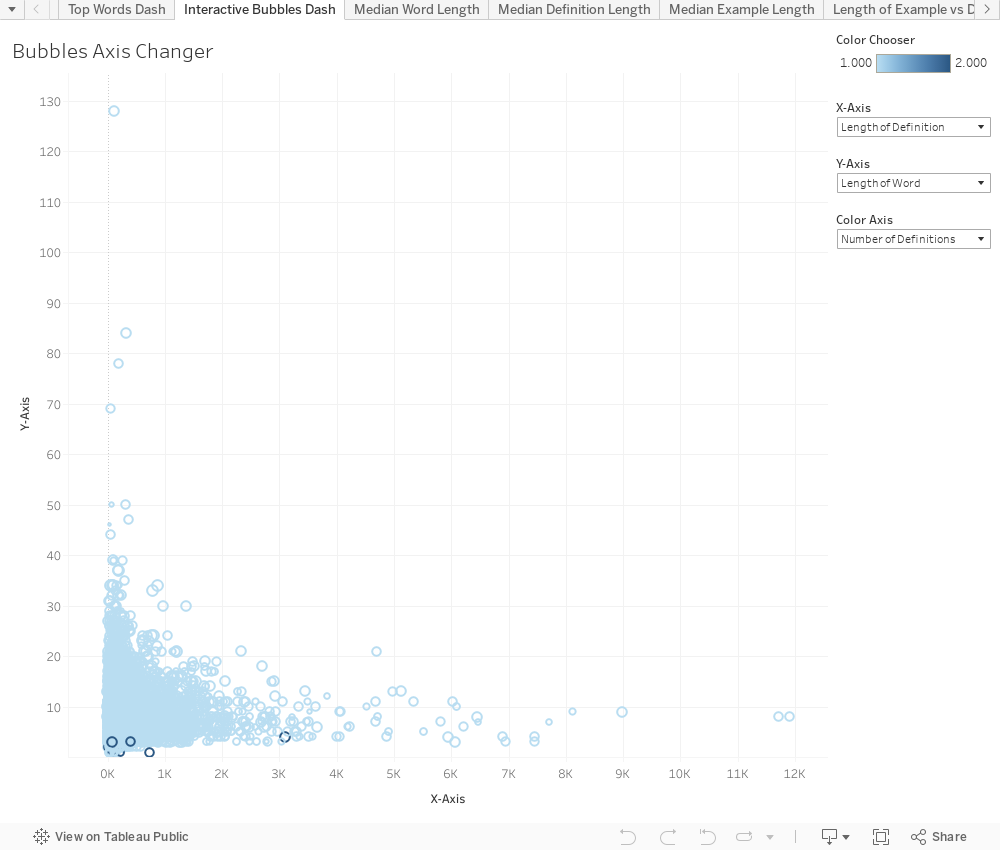


I was thinking because Urban Dictionary uses a "defid" field that seems pretty sequential so I wondered what some of the first words were. Obviously several had been deleted as out of the first 100 "defid" fields only 37 were left. The first remaining one that is visible is ID#7.... Janky which was posted December 09, 1999. The user Boomer is likely one of the first admins and has since posted 19 items total, most of which were at the very beginning of the site.

I hope every had as much fun kicking around in Urban Dictionary's data as I did! I know I learned some new swear words!

Who knew it was SO VERSATILE!
Of course if you have any questions or concerns please give me a shout in the comments below or via twitter @wjking0! As usual please share this if you found it fun/interesting!

How I felt after finishing this viz!

Monday, March 13, 2017

Buffy the Vampire Slayer 20 Year Anniversary & Strong Women on Television

This is part of my #1YearOfViz series! Check out the archive here: http://bourbonandbrains.blogspot.com/p/one-year-of-dataviz.html


I initially wanted to do a viz this week based on Buffy the Vampire Slayer for its 20th anniversary... I got my scrape all figured out and what all I wanted to look at. I considered pulling the Nielsen Ratings from Wikipedia only to discover it was lacking several seasons worth. 

Me when discovering Wikipedia was missing Nielsen data
I'm not a huge fan of their ratings system anyway though as the sample pool is so small they extrapolate more data than I'm comfortable with. (This is probably the reason they don't have a searchable database on their site.)

Then I remembered that IMDB had a ratings system embedded in it!

Thanks Giles! Finding data is my jam!
In my hunt for data I found this fun little viz of Buffy ratings and I based some of what I did initially off of this. I started thinking about doing a viz in a similar vein and then I thought "Why not add more data!?" So I changed up my Octoparse scrape and used a list URL format instead... then I thought about some of my favorite shows... Crap, there's a LOT of my fave shows that have strong female leads in them, what if I miss one!?

I decided to enlist the help of my social networks... when posting about strong female character TV Shows my friends did not run short on suggestions! After 50+ comments (most containing several shows each) I had a pretty solid list together and a much richer chunk of data than I initially was going to viz!

Realizing I now had about 50x more data than I intended...
While some of the shows had strong female roles I tried to limit my personal suggestions to shows where the female character played a lead role. Also I tried to stay away from characters (even if they had a lead role) who were a little too Damsel-in-Distress-y.

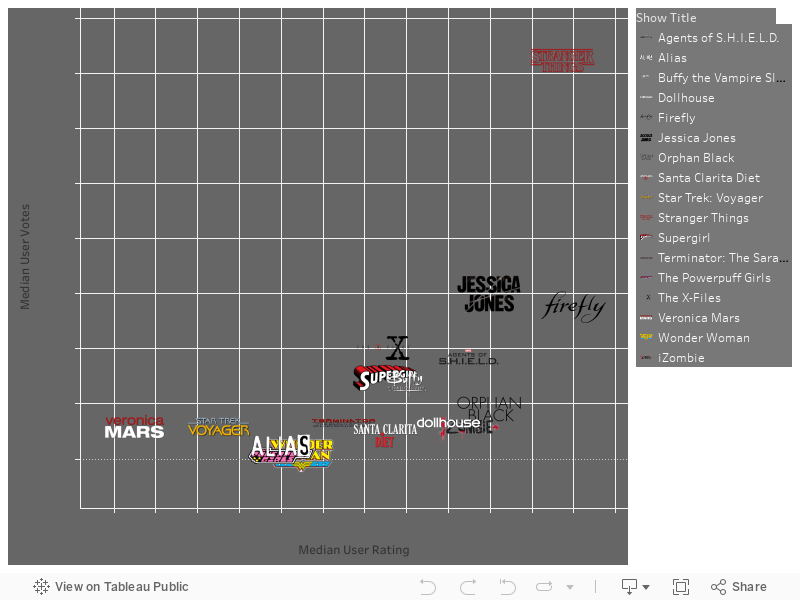
One of the first things I noticed was what a HUGE lead Stranger Things has had on basically EVERY other show out... don't get me wrong, it's FANTASTIC... example below along with the listing of "My Shows" that I looked at. Mouse over the icon to see median ratings and number of votes per episode.


Eleven is here to eat waffles and kick ass in ratings... and she's all outta waffles!

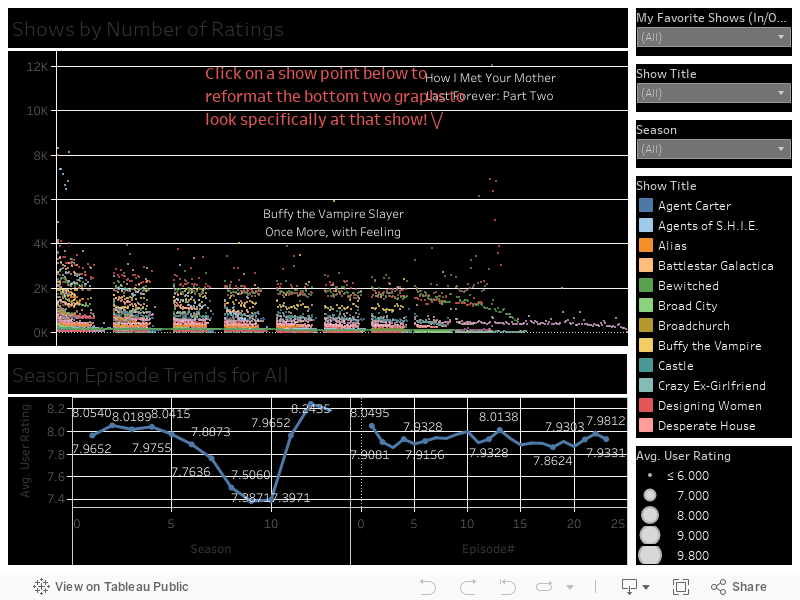
I decided to split it up like that example I looked at earlier and color episodes by season and then make them highlight-able and the ratings click-able. For this one I stuck with just my fave shows but I promise all you that put your input in.... the following viz will contain everything. I really like this one below though as I feel it's a fun way to explore the data, clicking around on things and highlighting the zillions of little show points. Kinda reminds you of the lights in Stranger Th--- ARGH gotta stop thinking about that show!


The one thing you should notice however is that the Buffy Episode "Once More With Feeling" is literally one of the highest rated shows EVER (out of this pretty large chunk of VERY popular shows)! So this following viz looks a little rough but contains the data from ALL the suggested shows (with one exception which I found didn't really have any strong female representation in it). The formatting gets a little gross with the dots on this as several of the "old" shows (like I Dream of Genie, and others from that era) had 40+ episodes to a "Season". Feel free to click around on the show points to reformat and see how your favorite shows did season to season or how their ratings changed per episode... Is your favorite show a strong finisher? Does it have a good trend towards mid-season finales? You can find out now!


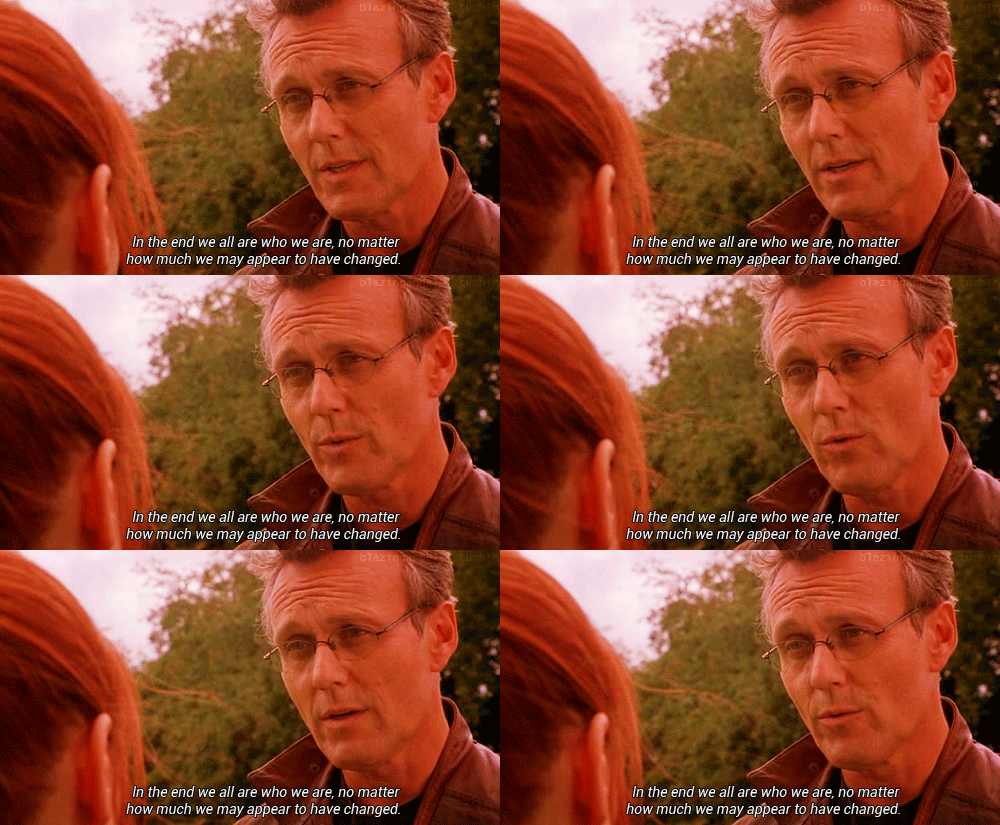
Same girl. Same.
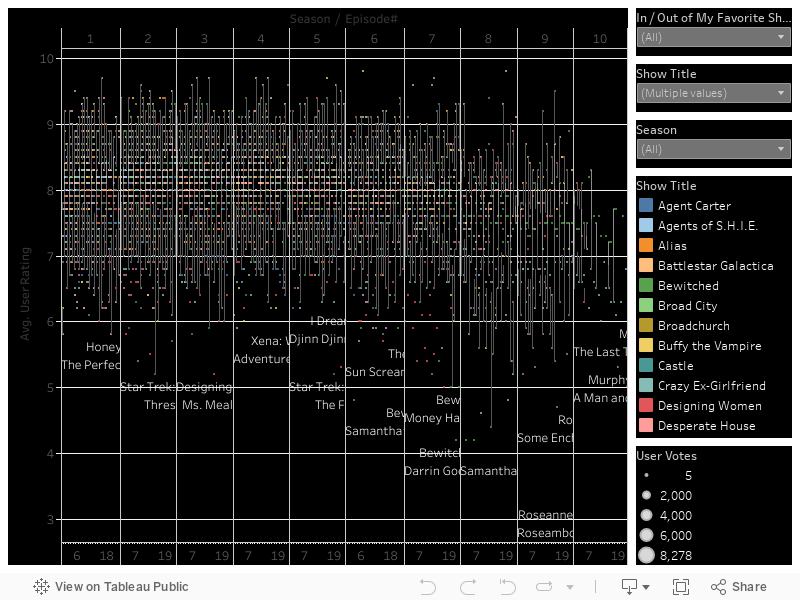
Finally I did this little number below which doesn't really DO much but is a nice representation of all the data and seeing the trends in shows/seasons by the density of the chart itself. Again this represents all data but I limited the number of episodes to 23 to keep it from getting too broke up due to the older programs.


As always if you have any questions leave a comment below or hit me up on Twitter @wjking0. Finally if you just need a good (ugly) cry you can relive some of the best Buffy moments here.


Monday, February 27, 2017

DashWrecks - The Best of CakeWrecks

This is part of my #1YearOfViz series! Check out the archive here: http://bourbonandbrains.blogspot.com/p/one-year-of-dataviz.html
I've been looking for a fun dataset to work with lately. While sitting around the other night my girlfriend and one of her kids was sitting around going through CakeWrecks.com and wailing with laughter.

How I hope people react to this less serious post!
They wondered out loud "I wonder which are the most 'popular' cakes...?" And I thought to myself... "You know who could find out.... !? I could!" So I went to work scraping all the posts made up until that point looking at metrics such as Facebook Shares, Pinterest Shares, Other Shares (I'm assuming twitter), and number of comments left on each post. I ignored "email" shares as the numbers were just really too low to make a difference in most cases (think single digits).


Before we get into the data I wanted to say that while this is only one Dashboard I put a lot of TLC into it... EVERYTHING is selectable/changeable ... you can change the measurements on the X and Y axis (labelled up/down and left/right for those non-math inclined people) to use any of the available measurements... and you can change the coloration to either be by 'Year' of publishing or by the Name of the person publishing. I included median lines so you can get an idea of approximately what the medians are for different types of measures... like for Facebook it's pretty high but Pinterest tends to be pretty low (comparatively speaking). One thing I noticed while I was playing around was that Pinterest interest (try saying that 5 times fast!) tends to be highest on 'Pretty' cake posts where as Facebook tends to love the Wrecks more!

Additionally you'll notice all the dots are all cake themed! I tried to pick appropriate dots for each user based on their frequency of posting... so yay custom icons in the viz! If you click on one of those cake-themed dots the left side of the screen will load up that particular post so you can browse each and every wreck! Anyway... click around and play with the data below!


I have to admit that one of the most widely cross-posted cake posts is also one of my favorite titles... "You want vagina cakes? I'LL GIVE YOU VAGINA CAKES." I literally though I was going to pee myself laughing at the title alone! Do yourself a favor and see if you can figure out which one that is to view that gem yourself! You know what the absolutely hardest part of doing this entire viz has been? Figuring out which of the MANY hilarious animated cake gifs to use!

Me trying to pick the right gifs to use for this post.


If you have any questions as always please hit me up on Twitter @wjking0 or in the comments below

Friday, February 24, 2017

FDA Inspection Data 2008-2016 #Resist

This is part of my #1YearOfViz series! Check out the archive here: http://bourbonandbrains.blogspot.com/p/one-year-of-dataviz.html


This is all of us in the data science community when we
heard whole datasets were just "disappearing" off .gov sites!
Given the recent trend of disabling publicly available data sources thanks to the President of the USA those of us in the public data science community have been frantically downloading all we can from .gov websites.

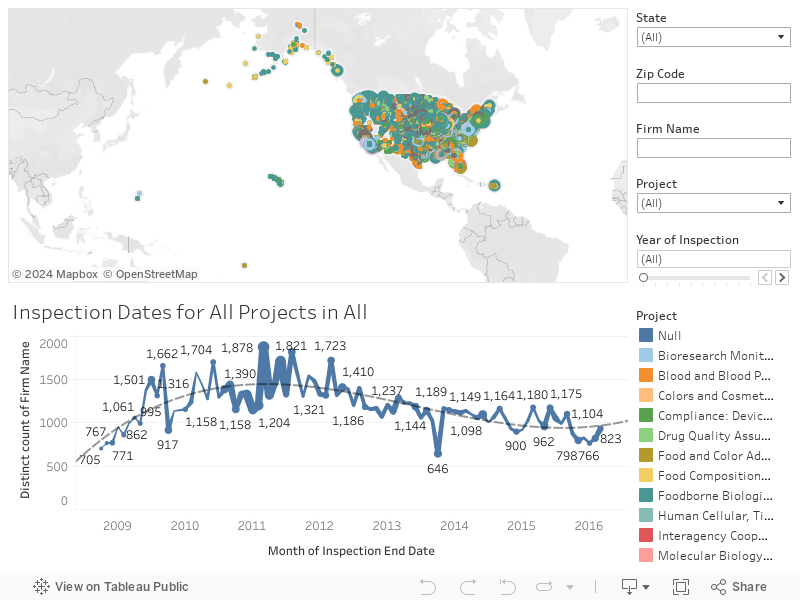
I'd heard that FDA was getting gutted so I wanted to look at inspection dates/locations. This viz isn't particularly fancy and I'm going to get to some more fun topics next week but I wanted to get this one out the door while I get my scrapper to stop crashing!
#dreamjob

Unfortunately they don't have the details of the inspections themselves or the results from them in this data. Still there are certain types of FDA inspections that are caused by complaints or warnings which can be figured out pretty quickly/easily.

For instance you can look at "Foodborne Biological Hazards" as these usually stem from complaints of food poisoning by multiple sources (as well as regular inspections). The trick then is to look for places that had multiple inspections on a particular year. I sized the bubbles by number of inspections in a particular year so you can quickly find groups that have had numerous inspections in a given year. When I actually got into the data you can see how much the FDA is responsible for, from checking laboratories, food creation locations, and even medical product testing (think artificial hearts etc). It's neat to see how many of these types of inspections happen each year.

Let's get into the data. There isn't a ton to this dashboard and all interactions are done with the filters on the right-side of the dashboard. I tried to include "City" in the data listed on the map unfortunately "City" is a field that caused a LOT of problems so I decided to just leave it out and kept in zip code.

As usual if you have any questions leave a comment below or hit me up on twitter @wjking0! Remember not to let data disappear! We need to be the digital monks of these digital dark ages and archive things in as many places as possible! #RESIST gang!
Me as a food inspector

Wednesday, February 15, 2017

The International Investments in Kentucky - Part 2


This is part of my #1YearOfViz series! Check out the archive here: http://bourbonandbrains.blogspot.com/p/one-year-of-dataviz.html
As promised I'd like to jump back into the data I started two weeks ago with information about international dollars that come into the state of Kentucky based on investments in businesses both foreign and domestic.

I just had SO MUCH DATA from the ThinkKentucky.com site that I wanted to split it into two different blogs so I could really not overwhelm browsers (particularly on mobile) with a huge page-load. Really though, too much data ... what a problem to have! I think the big thing also is the diversity of the data and the number of dimensions/measures that I was able to play with really allowed for a lot of interesting viz out of what's in there.


Originally I planned to write up something about the proposed trade restrictions on Mexico and how that could affect the Kentucky economy but after hashing out the data I wasn't really pleased with how it read. I'm a proponent of the NAFTA and unfortunately putting the larger amount that Mexico would have had to spend made it appear that the economy would be that much richer if the border taxes were enabled as proposed. Realistically though you can see in news stories such as this one... the real result is that when the cost becomes to much to export to a particular place a country finds another venue.

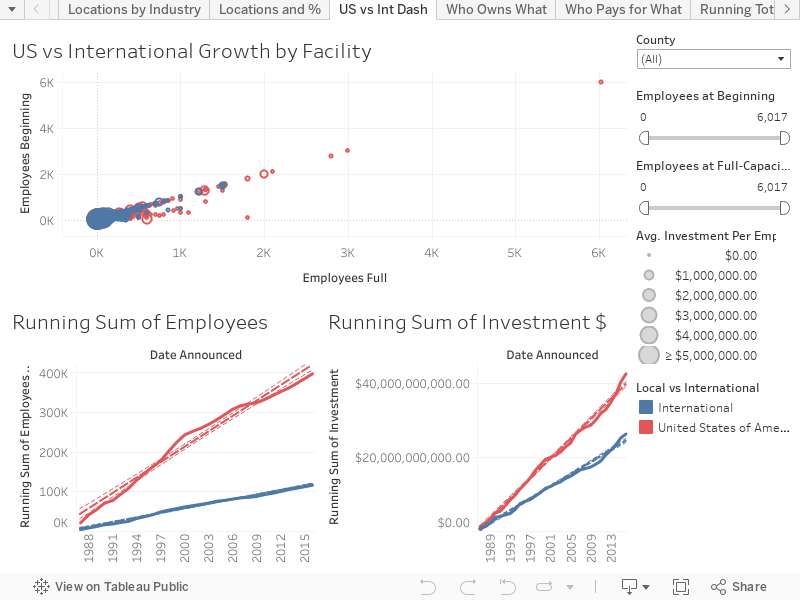
On this first dash I wanted to point out something; you'll notice that in the graphs below the running sum of investments by US vs International groups is MUCH closer than the personnel hiring. This lead to the bubble graph at the top showing Starting vs Full Employment numbers sized by the amount per person spend on the facility. There really isn't a whole lot of interactivity to this graph beyond looking at the County selection to see how each county has been funded over time. When combined with the other dashboard from part 1 you can really begin to get a more full view of how each county in Kentucky is impacted by international dollars.


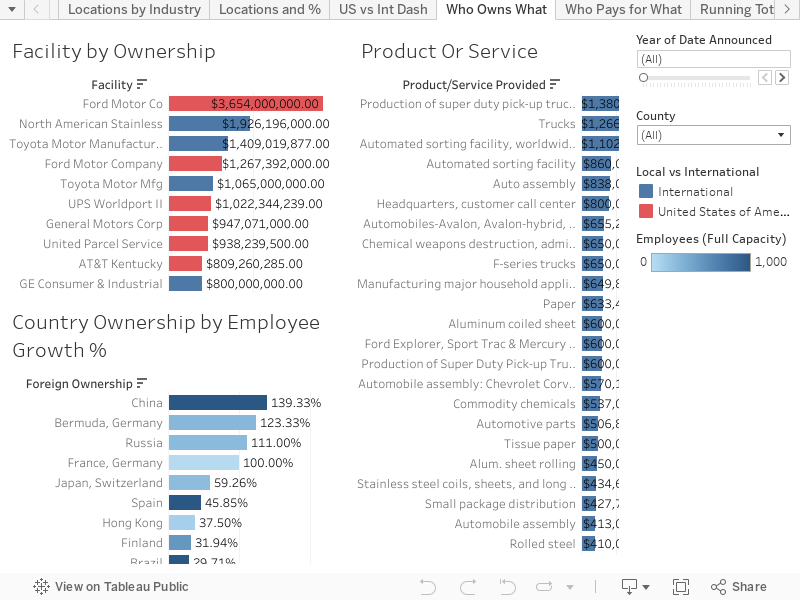
Who is providing the most job growth, for what places, and regarding what industries though? That's when I developed this next Dashboard to look at the ways the different countries funded different industries and with differing rates of job growth. All of the following bar charts just have to be moused-over to filter the other two charts further. As with the other chart you can choose to define it by county or even by particular year (though I feel adding both county/year tends to be a little too refining).


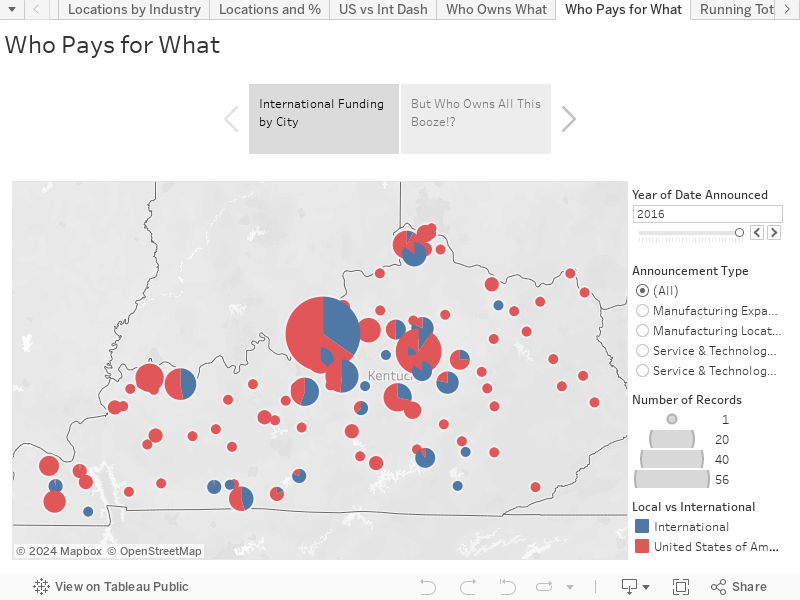
Lastly I have a little "story" I put together which has a breakdown of how much each City has had invested in it by US companies vs International companies... and while working on the Dashboard above I got thinking about distilleries and how many "Kentucky" distilleries were actually owned by a multi-national corporation. Mouse-Over the dots to uncover what Countries invest in your favorite drinks!

Four Roses funding is Japanese!


I wanted to share all this out, like I mentioned previously, because a lot of people want to separate the United States from the rest of the world. This is just a sample of how complex international business is within the relatively small state of Kentucky. So when ideas like changing HUGE trade agreements comes around... please try to remember all you've learned looking through all this data! As always if you have any questions or concerns please post them in the comments below or give me a shout at @wjking0 on Twitter!

Friday, February 10, 2017

Birth Rates & Life Expectancy by Population - Honoring Hans Rosling


This is part of my #1YearOfViz series! Check out the archive here: http://bourbonandbrains.blogspot.com/p/one-year-of-dataviz.html

As most of you know I was originally going to post the second part of my international money in the state of Kentucky visualization, the one that I started last week. However, with the death of Hans Rosling I have decided to do a memorial of sorts that is a re-creation of one of his most famous visualizations showing the population changes in the world overtime.

Below is a video of one of Hans Rosling's most famous lecture. He is known by many as the founder of modern data visualization and one of the first data scientist to really show people a data-driven world.


I wanted to re-create the animation he did using people and birthrates... unfortunately Tableau isn't exactly functional when doing animations so I used Windows 10 new "screen record" ability from the games menu to record video of the animation running. I then imported that video into Photoshop and was able to create an animated gif from it which you can see here. 

I feel this is a pretty accurate re-creation of his work and will be this week's #1YearOfViz visualization. The hardest part of this data was ETL'ing the proper sets from the United Nations data repository (how did I JUST NOW find this!?).

These are the sources for the dataviz:

At one point I accidentally did a "bad" join with some of the data replicating things to the point where I had over a BILLION rows of data (thus crashing Tableau Public). I didn't do much and unfortunately my animation isn't as "smooth" as Hans Rosling's but mine is by 5 year jumps instead of singular years (I'm guessing estimates were used in his data between the 5-year increments).

Here's my little quick viz I cranked out this week in honor of the amazing Hans Rosling's work:


I'll be publishing the second part of my International Money in Kentucky visualization next week so I can touch it up a little more! As always hit me up on twitter @wjking0 if you have any questions!

Dr. Hans Rosling... taker of NO shit.

Monday, February 6, 2017

The International Investments in Kentucky - Part 1

This is part of my #1YearOfViz series! Check out the archive here: http://bourbonandbrains.blogspot.com/p/one-year-of-dataviz.html
I'd like to start off with the fact that I live in one of the larger cities in Kentucky. Lexington is known for it's diversity of people and it's large international community. Given recent events and the recent gathering of people to protest the now overturned ban on people re-entering the US from several countries I thought it would be interesting to look at what the international community brings to the 'economic table' of Kentucky!

First a picture from one of my awesome junior roller derby skaters from the Lexington protest:
A photo posted by amelia (@amelia.loeffler) on


I found this data at the ThinkKentucky.com site which is actually the Cabinet for Economic Development. Their datasets weren't numerous but their site allows for a lot of search/interaction so I dug that! Thanks again for all the rad data and if anyone from there wants to give me a shout I'd love to get some more in depth data sometime!

That said, I designed over 25+ worksheets out of this data and realized it would be foolish (as well as poor time management) to squeeze them all into one blog post. So this week will be covering the viz I published last week and then a secondary part of the viz I've buffed up for this week! That way I'm totally still on schedule for publishing one a week!
Me when I looked down and saw I'd already created 25+
Tableau worksheets from data!
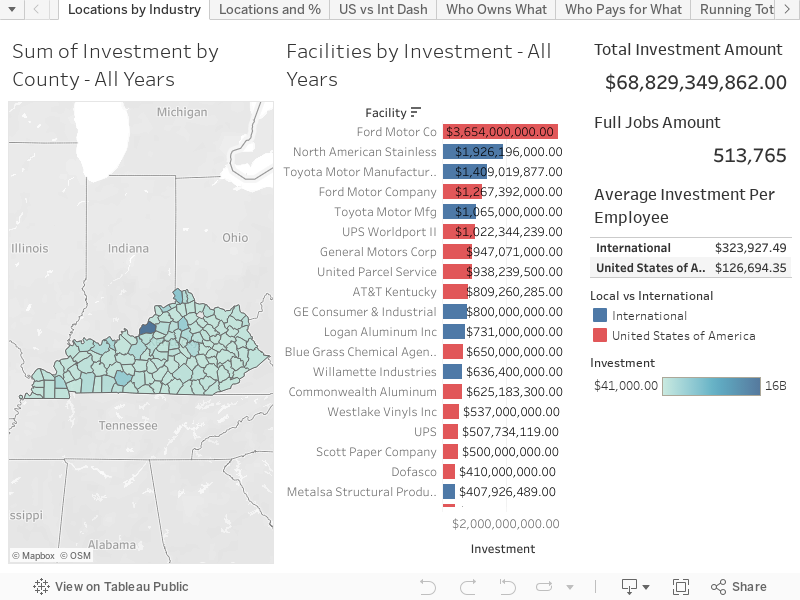
Let's get to it! I took investments in towns/counties and looked at how the domestic vs foreign interests were spread around... this first dashboard is a look at Total Investments in Areas by Facilities. If you mouse-over any county the industries that have invested in that county will be displayed to the right color-coded by their ownership (foreign or domestic).


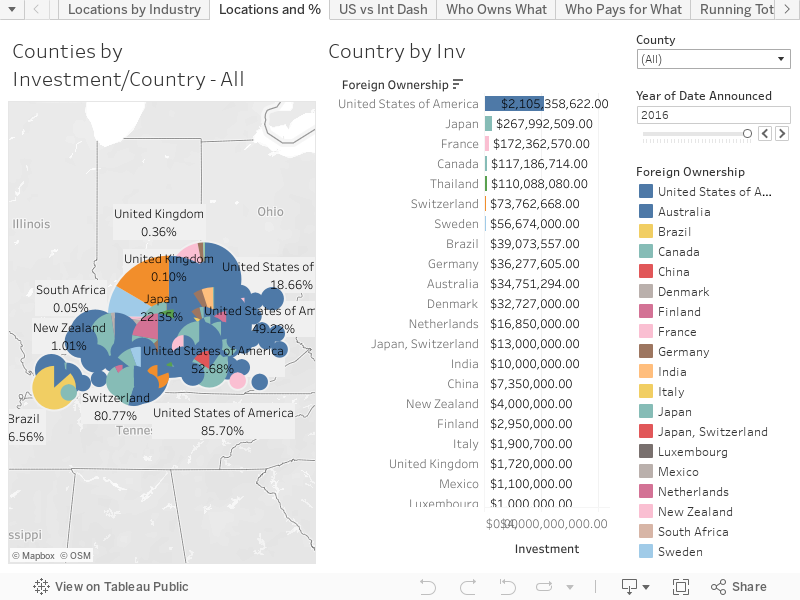
The second dash (and last one of today) is a little more in-depth breakdown of particular countries investments in counties in Kentucky. Again in this viz just mouse over an area to see it highlighted in the other half of the viz or for a more in-depth look by county or year feel free to manipulate the dropdown/slider at the top right of the viz.


I think the big thing to remember is that while we think of places as "American" literally 38.2% of investments in businesses in Kentucky over the last 2-3 decades or so have come from international money. With the climate of separatism that has arisen lately in these beautiful United States of ours... it's good to keep in perspective what international businesses have done for even rural areas in places like Kentucky with SERIOUS investment dollars!

Don't worry part 2 will be coming soon!
As always, if you have any questions or concerns leave a comment below or find me on twitter @wjking0!